Retention
14 Tactics to Reduce Subscription Churn (Data From 200M Subscriptions)
Backed by data from 25M+ subscriptions, across both kinds of churn.
Subscription businesses lose 39% of all customers they acquire each year. Even a seemingly low monthly churn of 5% means losing 46% of your customer base annually
Churn has two distinct types. Most operators can't tell you their split between the two. The 14 tactics below are designed to reduce subscription churn across both types.
Types of subscription churn
Voluntary churn is when a customer actively decides to cancel. They find the cancel button, submit a request, or call support. The reasons vary: price, product gaps, a competitor, or not getting enough value.
Involuntary churn is when a subscription ends because a payment failed. The customer didn't choose to leave. Their card expired, funds ran low, or their bank declined the charge. Often, customers don't know until they try to log in.
These are two different problems. Voluntary churn is a product and relationship problem. Involuntary churn is a payment infrastructure problem. For SaaS, 78% of all churn is voluntary and 22% is involuntary.
For example, on $10M ARR with 38% annual churn, voluntary churn costs $2.6M a year. Involuntary churn costs another $836,000.
The tactics for each type are completely different.
Part 1
How to reduce voluntary subscription churn
1. Find out why customers are actually leaving
Before you can fix voluntary churn, you need to know why it's happening.
The most common answer from exit surveys is budget. In Churnkey's State of Retention 2025 analysis of nearly three million cancellation sessions, budget limitations were cited 33% of the time and infrequent usage came second at 31%.
But budget is the easiest answer to give. In the freeform follow-ups, it often masks something else such as product frustration, unmet expectations, or a value gap.
A cancel flow survey asks customers why they're leaving before showing any offer, turning a cancellation into a data point. It's how Buildertrend turned cancellation reasons into six figures of recovered revenue in five months, at a 45% reactivation rate and $570 saved per customer.
Pick a cancellation reason to see the offer it routes to.
Why are you canceling?
Your feedback helps us improve.
2. Build a cancel flow
A cancel flow catches the cancellation before it goes through. It asks the customer why they're leaving, then shows an offer that matches the reason they're leaving for.
Someone who says it's too expensive sees a discount or a pause. Someone who isn't using it enough sees a pause or a downgrade. The offer matches the problem, so it has a real chance of working.
Superhuman turned its cancel flow into a seven-figure growth lever, with a 4% retention uplift from cancel flows alone.
The data shows that across three million cancellation sessions, discounts are accepted 62% of the time, pauses 22%, and plan changes 8%.
3. Expand your offer stack beyond discounts
Don't offer discounts to everyone, not everyone wants one. The data shows that other offer types also perform well to keep customers around for the long term.
| Offer | LTV added | Comment |
|---|---|---|
| Discounts | +5.1 months | 11% still subscribed a year later, after the discount expires. |
| Pauses | +5.5 months | Accepted 15 seconds faster than discounts on average. |
| Plan changes | +7–8 months | 30% of customers who accept are still active at 12 months. |
Superhuman used seat downgrades and account pauses instead of full cancellations, cutting team-seat removals by 15% and turning them into a seven-figure growth lever.
Each offer maps to a different cancellation reason. Build all three into your cancel flow. Churnkey's Adaptive Offers selects the right offer for each customer automatically, based on their behavior, plan, and stated reason for leaving.

4. Fix onboarding to reach value faster
Much of voluntary churn is decided in the first few weeks, not months in. Infrequent usage is the second most common cancellation reason — most of those customers encountered the product but never built a habit with it. The fix is to get them to value faster.
| Cancellation reason | Share of cancellations |
|---|---|
| Budget limitations | 32.97% |
| Infrequent usage | 30.6% |
| Other reasons | 17.85% |
| Expectations not met | 8.63% |
| Technical issues | 4.69% |
| Alternative solution | 4.28% |
| Usability challenges | 0.98% |
Source: Churnkey State of Retention 2025, 3M+ cancellation sessions.
5. Track which features customers stop using
Are people logging in? Are they using all the features? What is the difference in feature usage between those that churn and those that retain? Answers to these questions can help decide which features to promote and which to sunset.
6. Move customers to annual plans
Monthly subscribers reconsider every 30 days. Annual subscribers make one decision a year. Companies with 25% to 50% of customers on annual contracts see 5.63% monthly revenue churn. Companies with no annual option average 10.40%.
Presenting a discounted annual rate as a plan change within a cancel flow converts a save into a longer commitment. By the time you read this article, term optimization may be a well-optimized feature in Churnkey.
Part 2
How to reduce involuntary subscription churn
7. Quantify your involuntary churn
Most retention work focuses on voluntary churn. Involuntary churn runs quietly in the background. From Stripe and Churnkey combined analysis, involuntary churn accounts for 9% in B2C companies and 6% in B2B companies. We have more breakdowns in that report.
| Business model | Annual involuntary churn rate | Involuntary as % of total churn |
|---|---|---|
| B2C | 9% | 24% |
| B2B | 6% | 16% |
Source: Stripe.
This split tells you how much can be recovered without any product changes at all.
8. Set up precision retries
Most of the involuntary churn can be recovered without engineering effort. Precision retries use ML models to identify the most optimal time to retry a failed card. If you use basic retries from your billing provider, these stack on top of them and provide greater revenue recovery. In 2024, Churnkey recovered 70% of all involuntary churn detected.
Mastercard allows 35 retry attempts and Visa allows 15 within a rolling 30-day period, with fines up to $15,000 for exceeding them.
9. Run dunning campaigns
Some failed payments can't be recovered with a retry. Hard declines, like a stolen card or a closed account, need the customer to update their payment method. A dunning campaign is a sequence of emails and SMS messages triggered by a payment failure. Churnkey's data shows that 61.2% of recoveries happen in the first seven days but you still see recoveries after the first week. So, it's important to play the long-tail game.
The first message should go out within hours of the failure, with each subsequent message escalating as the window closes. Churnkey's dunning campaigns run across email and SMS with A/B testing built in.
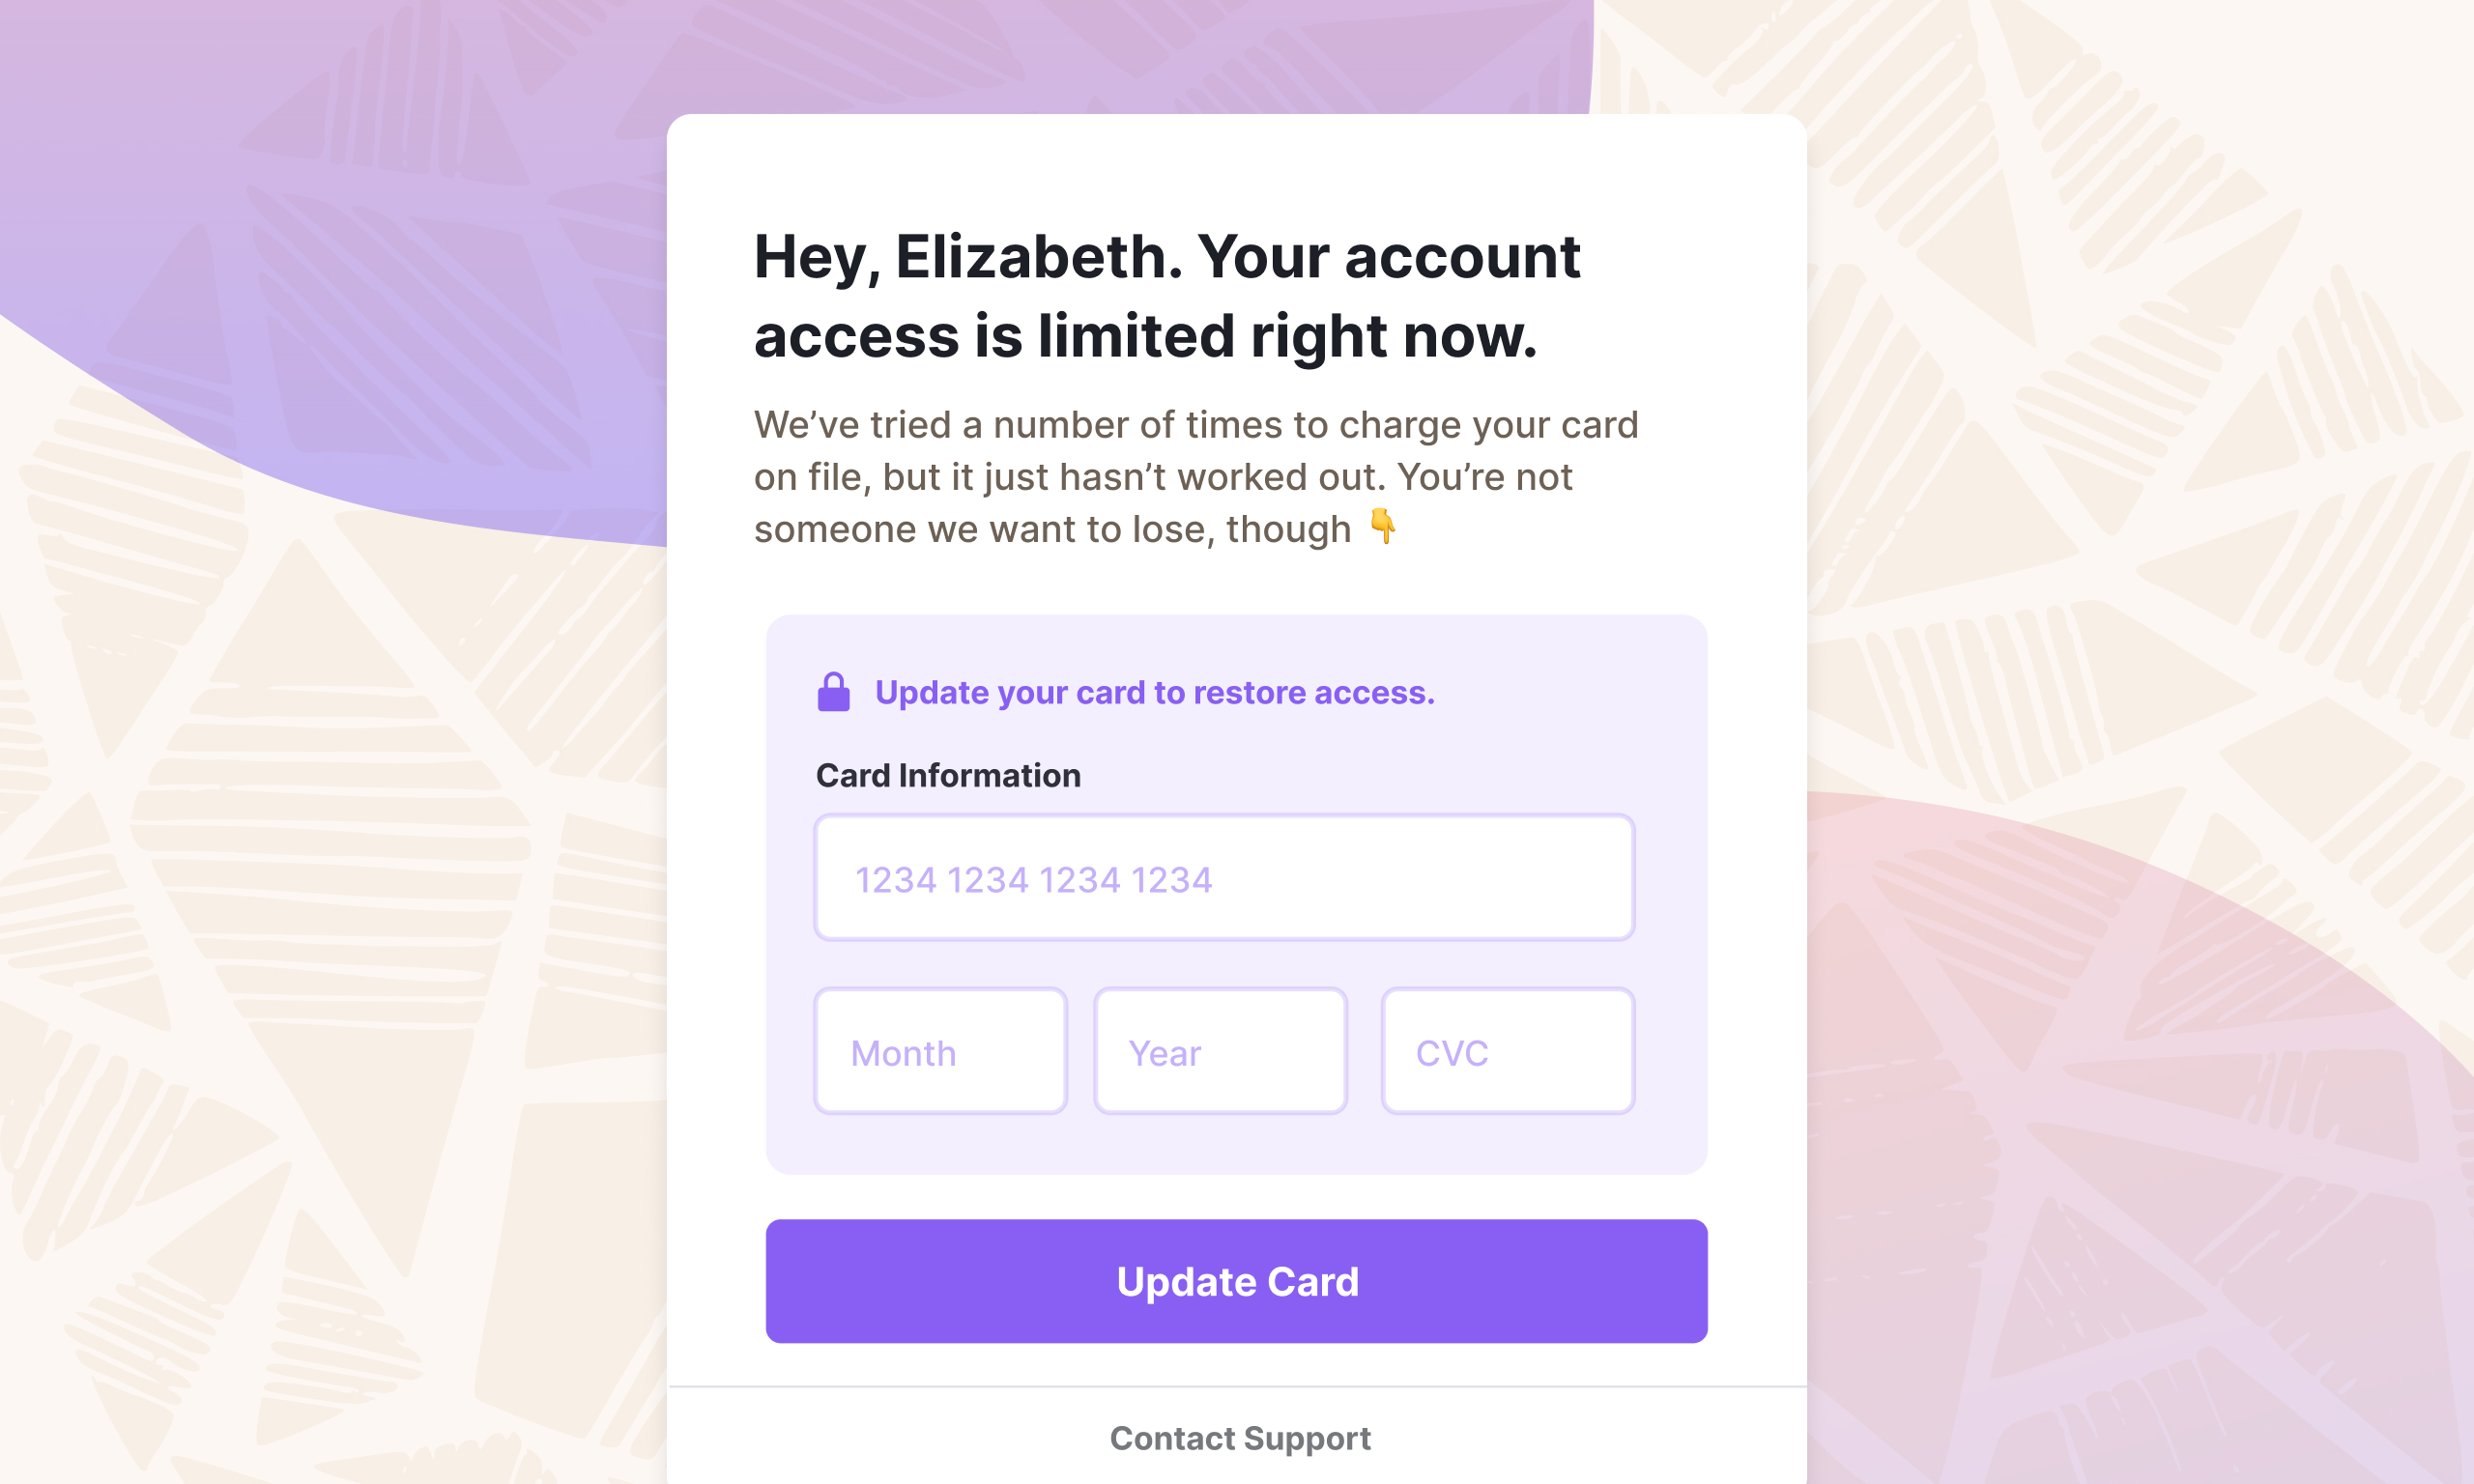
10. Deploy a failed payment wall
Many times, the customer is already in the product but doesn't know the payment failed. A failed payment wall intercepts access when a payment has lapsed and surfaces an inline card-update form. The customer is already in the product and wants to use it. Making the card update process as frictionless as possible with the fewest possible bugs is the right way to go about it. See how Churnkey's failed payment wall works.
11. Get ahead of card expirations
On an average, expired cards account for 1.14% of all failed payments which may not be a lot if you're a smaller company, but at scale, every percentage point matters. Sending an email 30 to 60 days before the expiry date will be most effective. Card expirations are predictable events. It's already available in your billing data today.
Part 3
More ways to reduce subscription churn
12. Watch for disengagement signals
Churn signals show up in many different ways. For example:
Radio silence
No logins or email opens suddenly.
Stalled progress
Not expanding activity or trying new things.
Executive disengagement
In B2B, senior stakeholders stop joining calls or delegate renewals to junior staff.
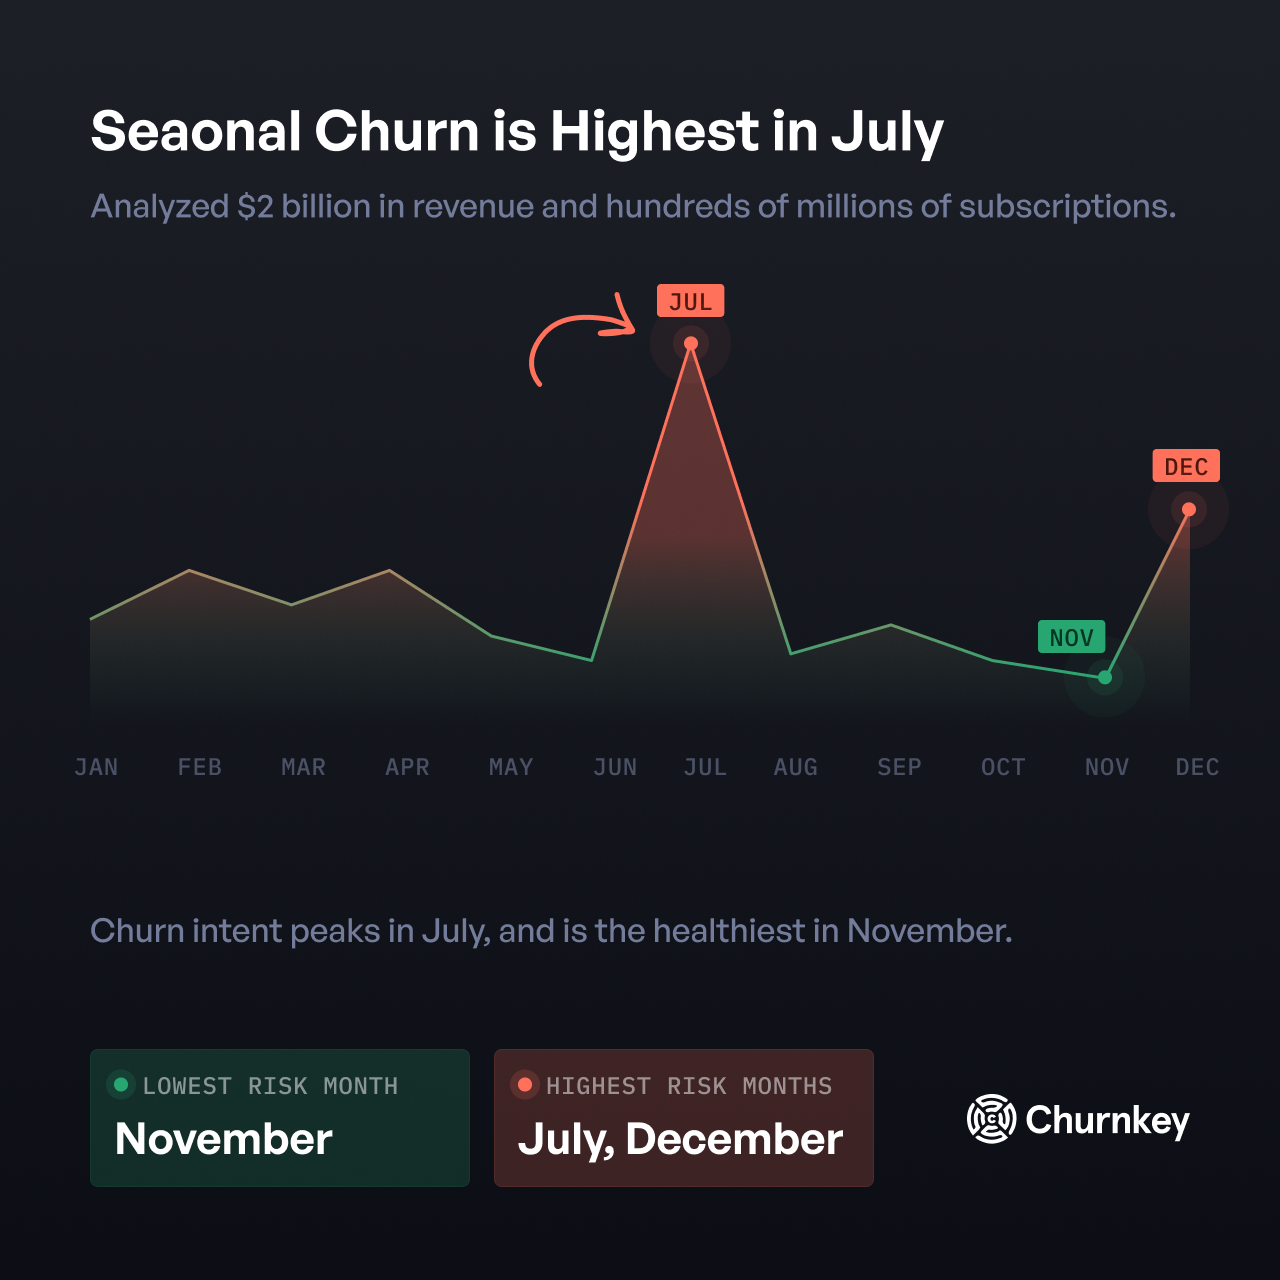
13. Plan for seasonal churn spikes
From Churnkey's seasonality data report across a three-year dataset, July has the highest churn intent, running 47% higher than the May baseline. December through February is the second peak. November is the healthiest month.
Tactics
- Reach out to customers when they're ready to buy.
- Run well-thought out retention campaigns before high churn months.
- Keep more cash during slow seasons.
- Increase collections during peak periods for example, by encouraging users to switch from monthly to annual.
- And more
14. Benchmark against your actual cohort
Churn and price are inversely related, from 40% annual churn under $10 AOV down to 15% above $10,000.
| Average order value | Annual churn rate |
|---|---|
| Less than $10 | 40% |
| $10 to $30 | 37% |
| $30 to $100 | 34% |
| $100 to $1,000 | 30% |
| $1,000 to $10,000 | 24% |
| Greater than $10,000 | 15% |
Source: Stripe and Churnkey.
If your churn is higher than the benchmark for your price point, the product is worth examining. Churnkey's data report on the path to $100M ARR also found that for B2B SaaS, churn improves as the company scales. For B2C under $20 per month, it worsens.