AI tools
Marketing tools
Creative tools
Developer tools
Productivity tools
Operations tools
This report combines data from Stripe with Churnkey's retention suite to bring you the most comprehensive churn insights on voluntary churn.
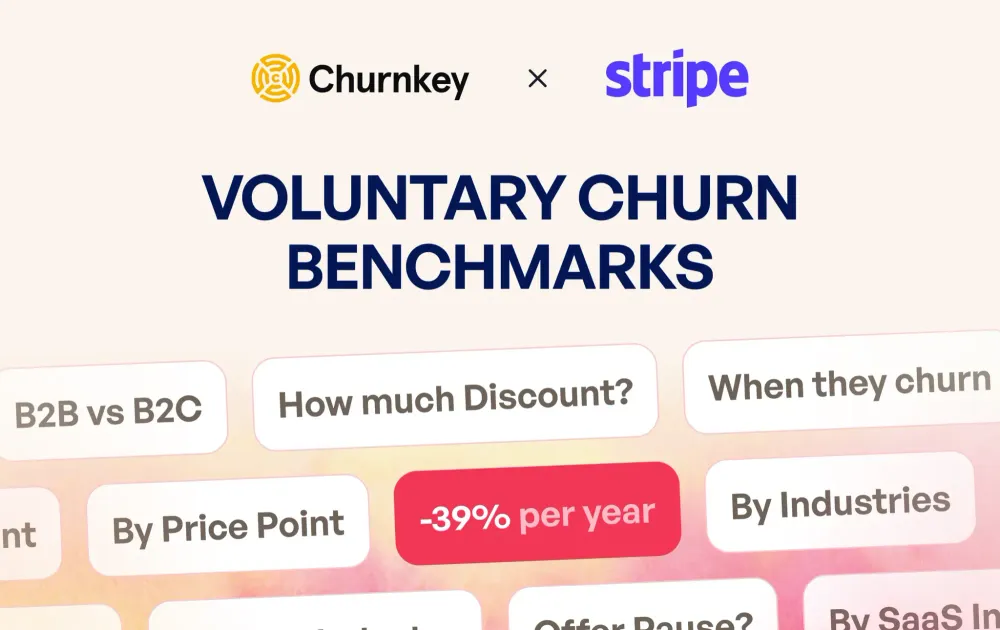
Churnkey partnered with Stripe to publish one of the most detailed breakdowns of voluntary churn available today.
In 2024, Stripe processed $1.4 trillion across 200 million subscriptions. Churnkey protected over 25M subscriptions over the past year.
This report combines data from Stripe with Churnkey's retention suite to bring you the most comprehensive churn insights on voluntary churn.
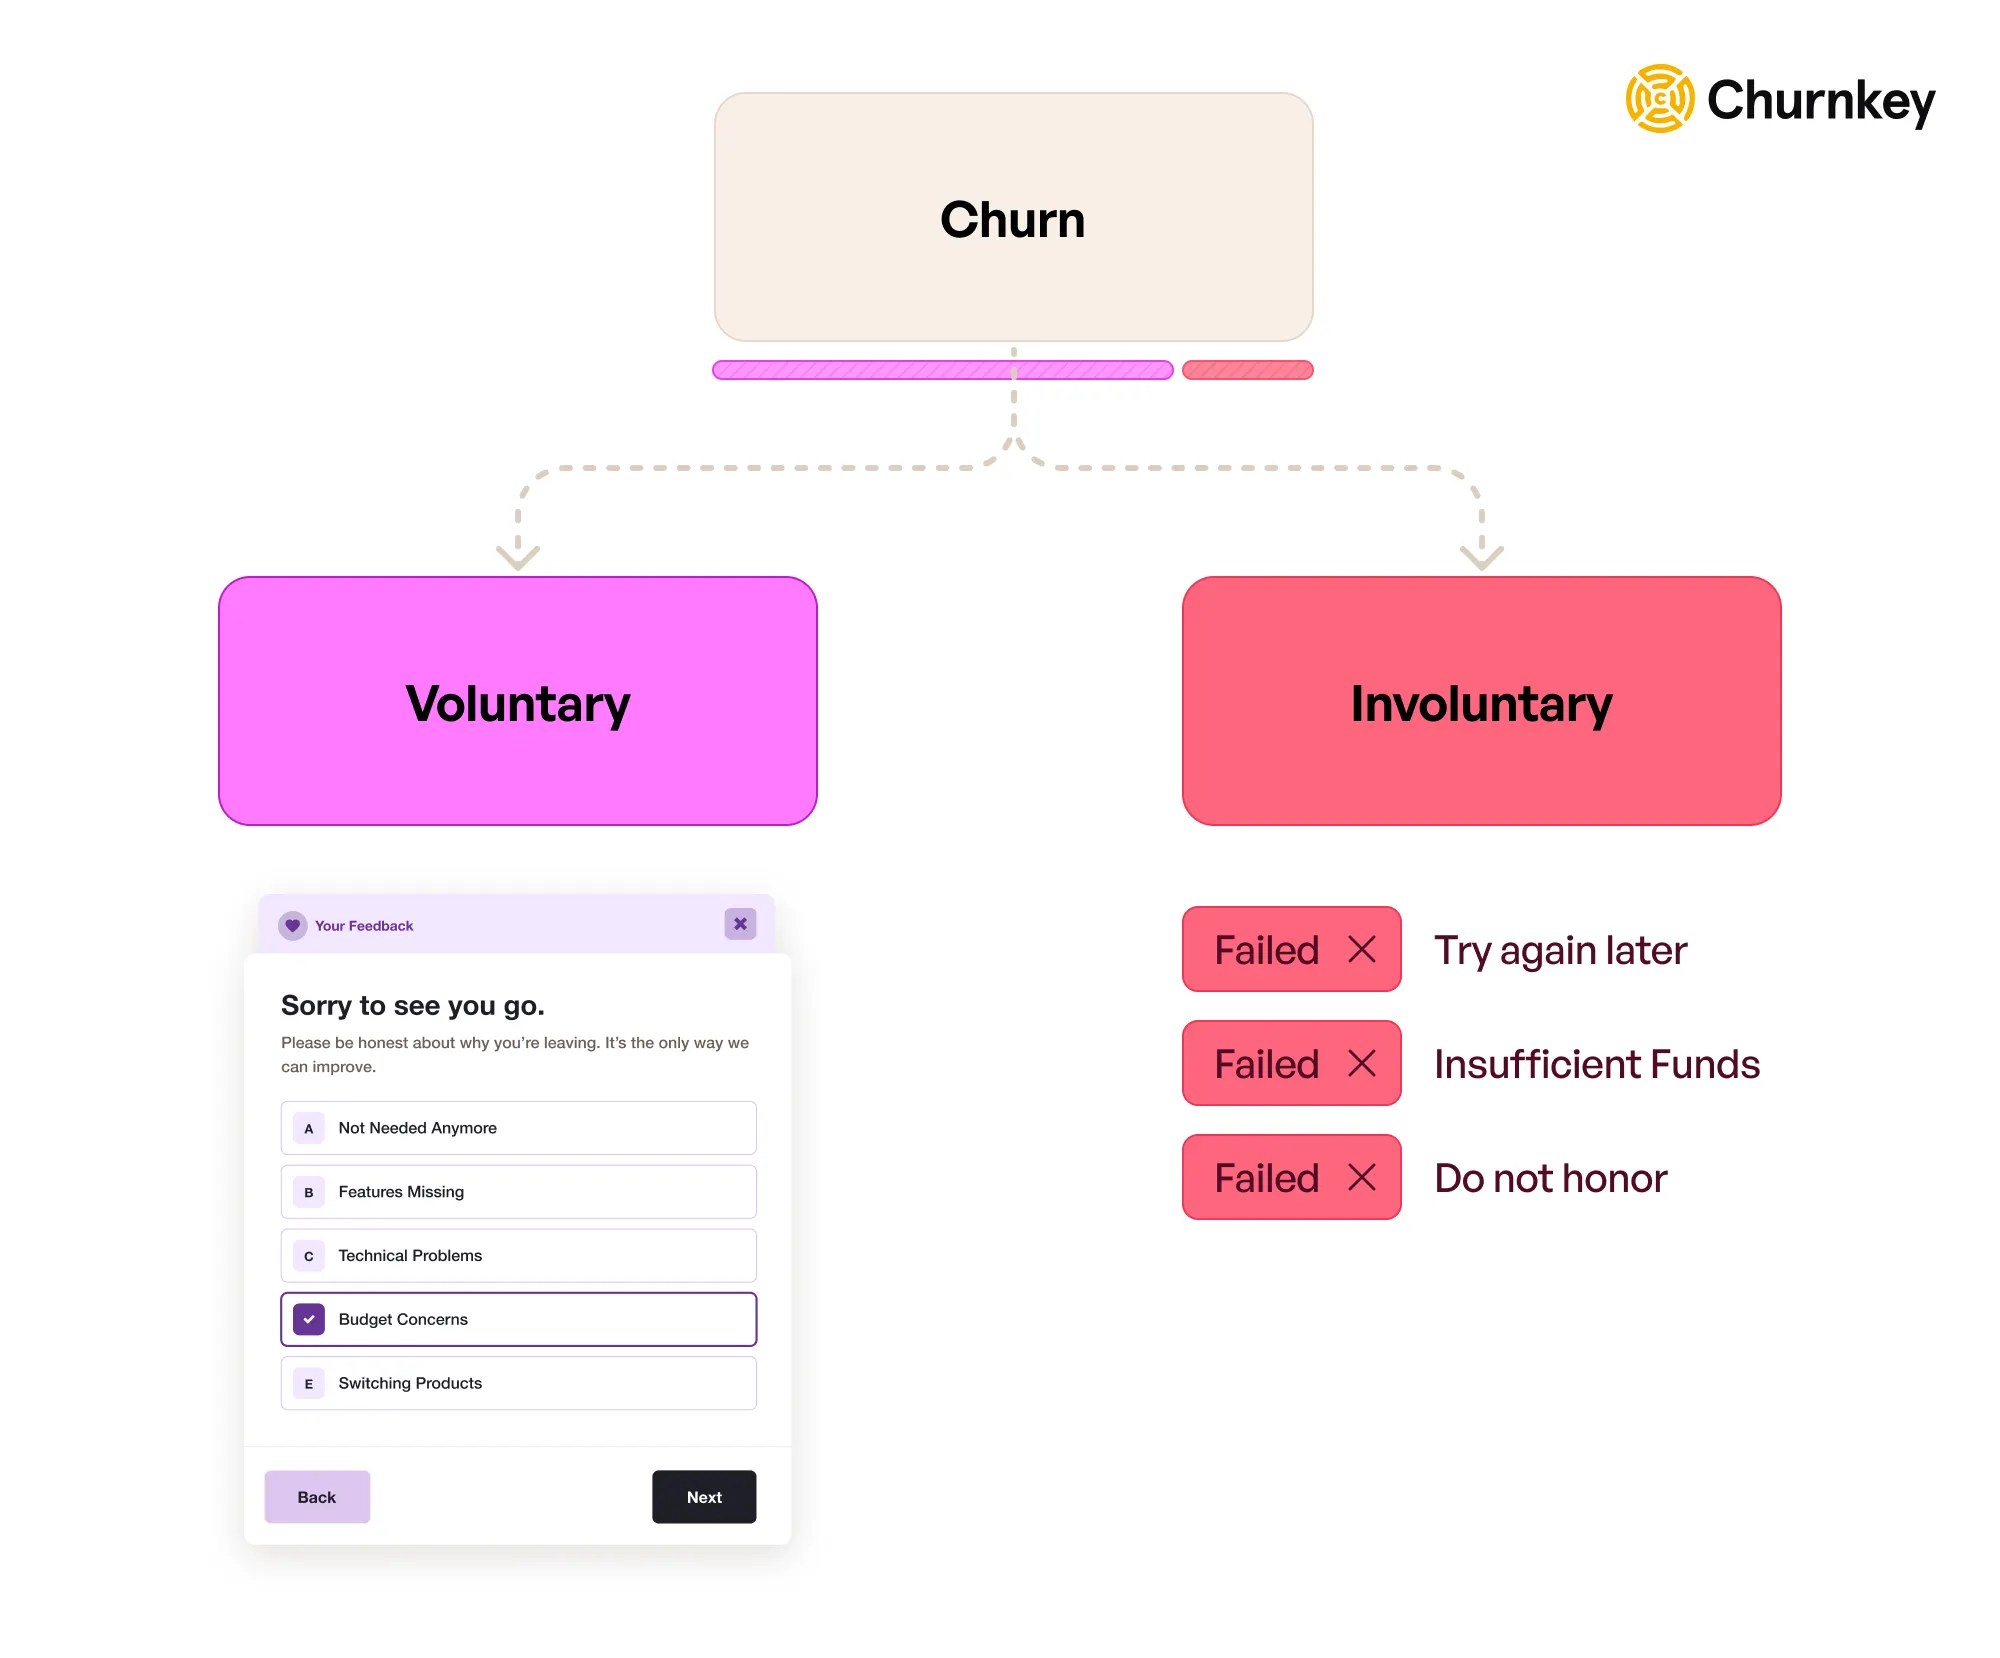
Voluntary churn happens when people raise their hand to quit the service. They may reach out to your customer team or cancel self-serve in the product.
For the majority of high-volume subscription businesses, voluntary churn makes up the bulk of all churn, so it's important to focus on it individually.
The data below covers subscription transaction data across businesses on Stripe. On average, subscription-based businesses lose 39% of all customers they acquire. On the furthest end of the spectrum, we have travel companies who lose 43% of all customers they acquire. SaaS is at 39% annual churn.
| Industry | Monthly churn* | Annual churn |
|---|---|---|
| Travel and lodging | 4.70% | 43% |
| Business services | 4.20% | 40% |
| Education | 4.20% | 40% |
| Merchandise | 4.10% | 39% |
| Digital goods | 4.00% | 38% |
| SaaS | 4.00% | 38% |
| Insurance | 3.90% | 37% |
| Personal services | 3.70% | 36% |
| Leisure | 3.70% | 36% |
*Source: Annual churn rates are from Stripe; monthly churn rates calculated by Churnkey.
When we break down these churn rates by voluntary rates, we see a different picture.
We’ve added two columns — total voluntary churn rate, and % of voluntary churn to help analyze the data. As you can see, the bulk of all churn is voluntary.
| Industry | Total annual churn rate | Annual voluntary churn rate | Voluntary churn as a % of total churn |
|---|---|---|---|
| Travel and lodging | 43% | 35% | 82% |
| Business services | 40% | 30% | 74% |
| Education | 40% | 30% | 76% |
| Merchandise | 39% | 30% | 77% |
| Digital goods | 38% | 27% | 71% |
| SaaS | 38% | 29% | 78% |
| Insurance | 37% | 33% | 91% |
| Personal services | 36% | 27% | 75% |
| Leisure | 36% | 30% | 83% |
🟢 Digital Goods companies have the lowest proportion of voluntary churn at 71% of all churn due to voluntary reasons.
🔴 Insurance companies experience the highest percentage of voluntary churn. Nearly 91% of all churn is voluntary. Insurance companies have little trouble with failed payments.
🟡 For SaaS companies, involuntary churn rate averages at 78% of all churn. That means, if you’re doing $10M a year in revenue with 38% annual churn, you’re losing $2.6M in voluntary churn.
Try it here:
B2C vs B2B churn rates look nearly identical.
B2C companies lose 39% of all customers each year, whereas B2B companies lose 38%.
| Business model | Monthly churn rate* | Annual churn rate |
|---|---|---|
| B2C | 4% | 39% |
| B2B | 3.82% | 38% |
However, B2B companies seem to lose more due to voluntary churn than their B2C counterparts. 84% of all churn for B2B companies is due to self-initiated cancellations.
| Business model | Annual churn rate | Annual voluntary churn rate | Voluntary churn as a % of overall churn |
|---|---|---|---|
| B2C | 39% | 29% | 76% |
| B2B | 38% | 32% | 84% |
Source: Stripe
Data shows that price and churn are inversely related. As price decreases, churn increases.
| Average order value | Annual churn rate | Voluntary churn rate | Voluntary churn as a % of total churn |
|---|---|---|---|
| Less than $10 | 40% | 26% | 65% |
| Between $10 and $30 | 37% | 28% | 77% |
| Between $30 and $100 | 34% | 25% | 74% |
| Between $100 and $1,000 | 30% | 24% | 81% |
| Between $1,000 and $10,000 | 24% | 20% | 85% |
| Greater than $10,000 | 15% | 11% | 76% |
Source: Stripe
However, voluntary churn doesn’t stay linear.
For prices lower than $10, voluntary churn is 65% of all churn. But when prices increase, the proportion of voluntary churn increases.
This means, the lower the price, the lower the proportion of voluntary churn.
Focusing on SaaS businesses shows an interesting picture. AI companies have the highest overall churn.
Source: Churnkey
And voluntary churn continues to make up a high proportion for AI companies. Voluntary churn is the relatively lower for developer tools.
Source: Churnkey
The Takeaway:
Cancellation sessions are shown when people navigate to the cancel button in your app. A cancellation survey asks people why they want to cancel.
Data from 2M cancellation survey responses across 5M unique cancellation sessions shows that budget limitations and infrequent usage were the primary reasons why people stopped using most products. It wasn't due to usability or technical issues.
Source: Churnkey
Action: Track why people leave. For product gaps, set up a continuous monitoring system that maps MRR lost to the feedback category. Churnkey offers Feedback AI.
There are a few different offers that work to retain customers that are about to leave. Discounts work best. Then pauses. And lastly, we’ve got plan changes.
Trial extensions are offered to free users. They have a lower acceptance rate simply because the audience is relatively more top-of-funnel.
Source: Churnkey
Action: Meet customers where they are. Not everyone needs a discount. Some people just need a pause. See how Churnkey solves it with Cancel Flows.
We measured the most accepted discount rate across millions of cancellation sessions and found that there is no right answer.
Sometimes, offering a higher discount percentage can reduce acceptance rates as well.
Source: Churnkey
Action: If you have the means to segment customers by plan type, usage patterns, and other variables, do so. A step above would be building an AI model for your business that makes a unique offer to each customer. See how Churnkey solves it with Adaptive Offers.
The data showed that everyone accepted pauses, whether they were new or loyal customers. Loyalty had little to do with pauses.
Of course, the longer someone stays with you, the more likely they were to accept a pause. But it hovered around the ~15% mark after someone stays past their second month.
Source: Churnkey
Action: Let people pause their subscriptions, instead of cancelling. Pauses are the 2nd most effective retention offer, after discounts. Go a step further and let people choose the duration on how long they want to pause their subscription for. See Churnkey’s documentation on pauses.
New customers are the most at risk of leaving. Churn drops sharply after the first few months, then continues to decline gradually as loyalty builds. The longer someone stays, the less likely they are to cancel.
Source: Churnkey
Action: Focus on your churn strategy right alongside your customer acquisition strategy. Delaying this by as little as 3 months means you lose the opportunity to retain 5% of the customers. View Churnkey’s free Churn Metrics dashboard.
If you enjoyed this report,
Churn is one of the hardest problems to solve. It demands cross-functional collaboration and deep expertise across teams.
Partnering with Churnkey gives you access to a best-in-class retention suite that tackles both voluntary and involuntary churn.
We integrate natively with Stripe, which means two things:
We'd love for you to check out the product, and see what we've built.
Sign up for Churnkey or book a demo. Then, install our Stripe app which provides a 1-click integration.