The Complete Guide to Seasonality: We Analyzed $2 Billion and Millions of Subscriptions
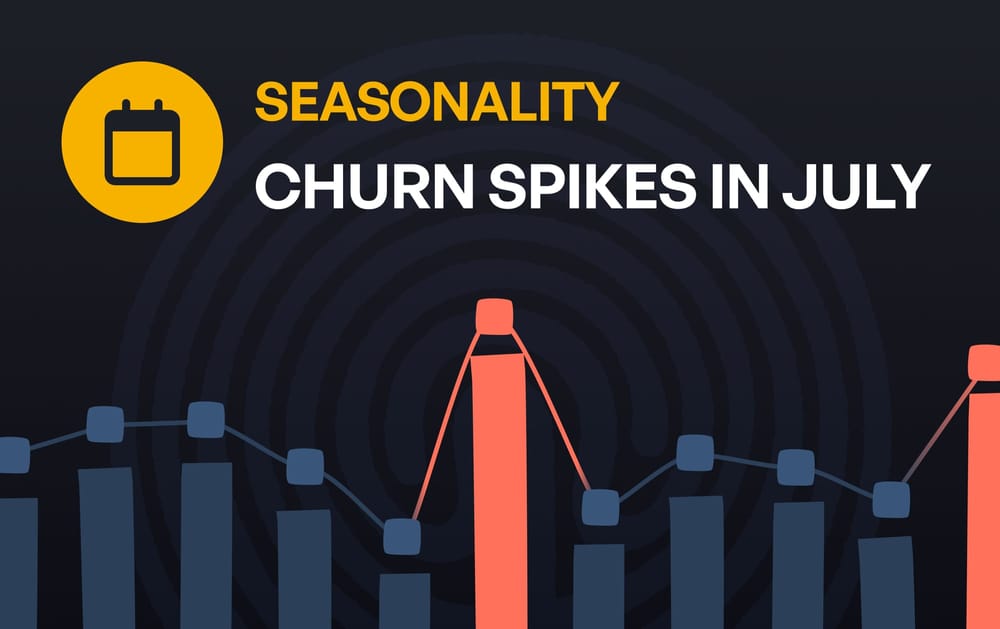
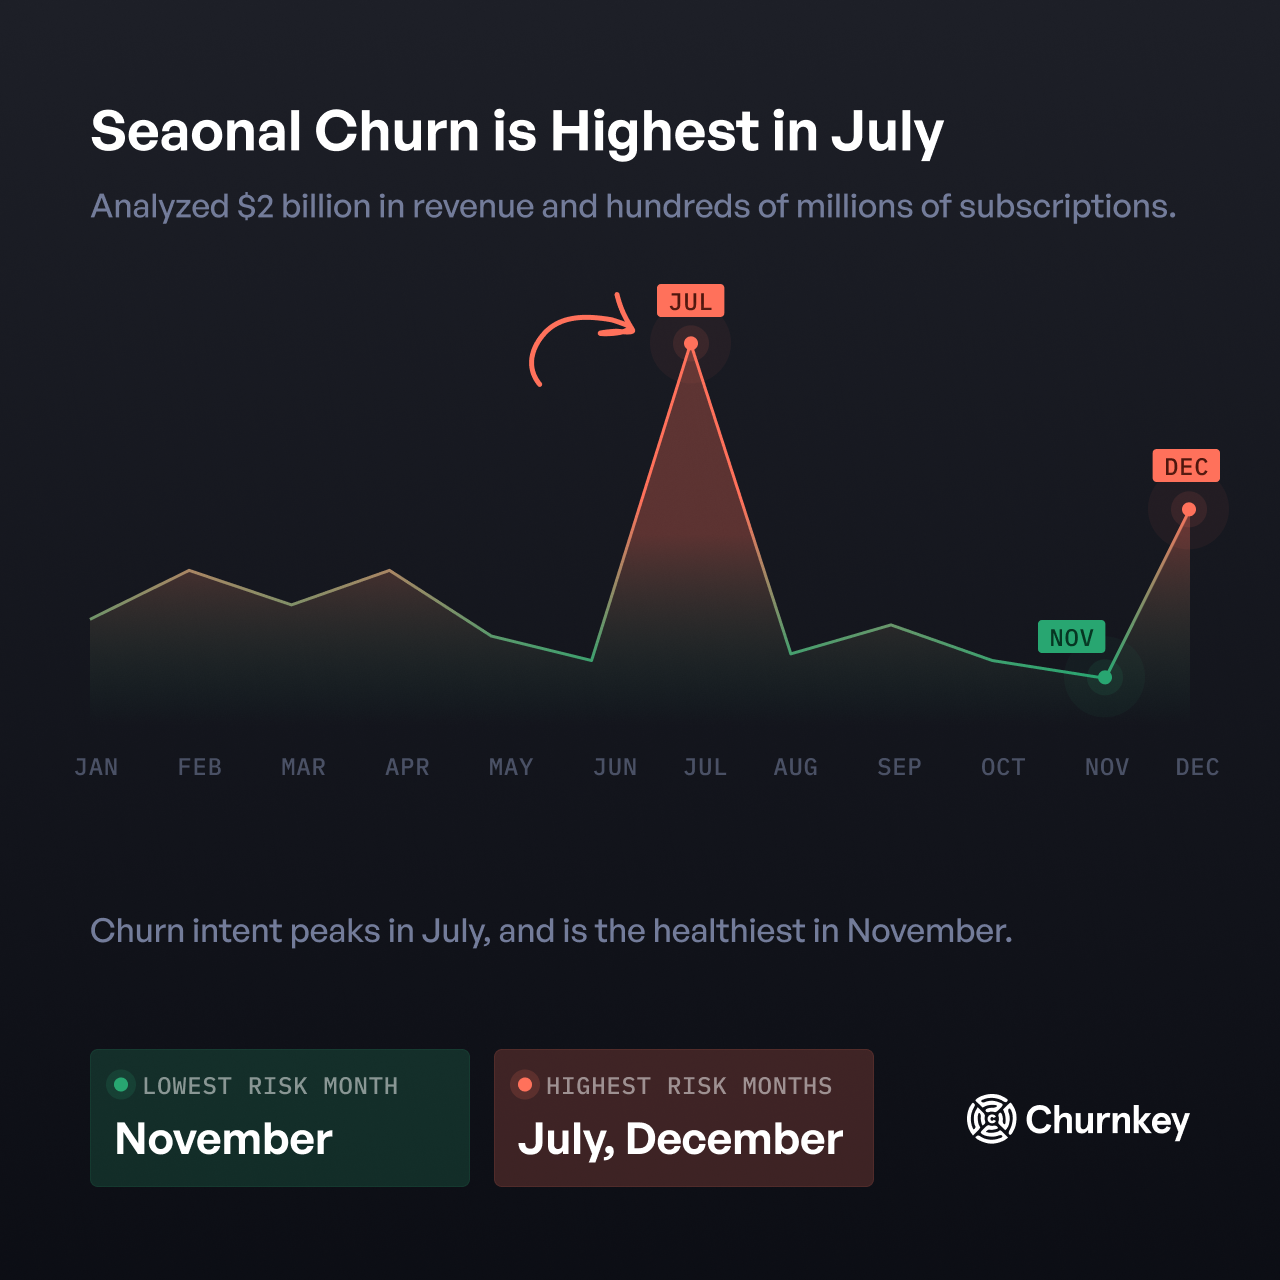
Data reveals a clear pattern: July has the highest churn rates across SaaS companies. This means people actively go to the cancel button, even though some may change their mind later.
This comes from real Churnkey data analyzing over $2 billion in revenue and hundreds of millions of subscriptions across SaaS companies.
July has the highest churn intent rates across SaaS companies. Churn intent jumped 47% compared to May baseline.
July accounts for the highest normalized churn sessions per 1,000 subscribers across a 3-year dataset.
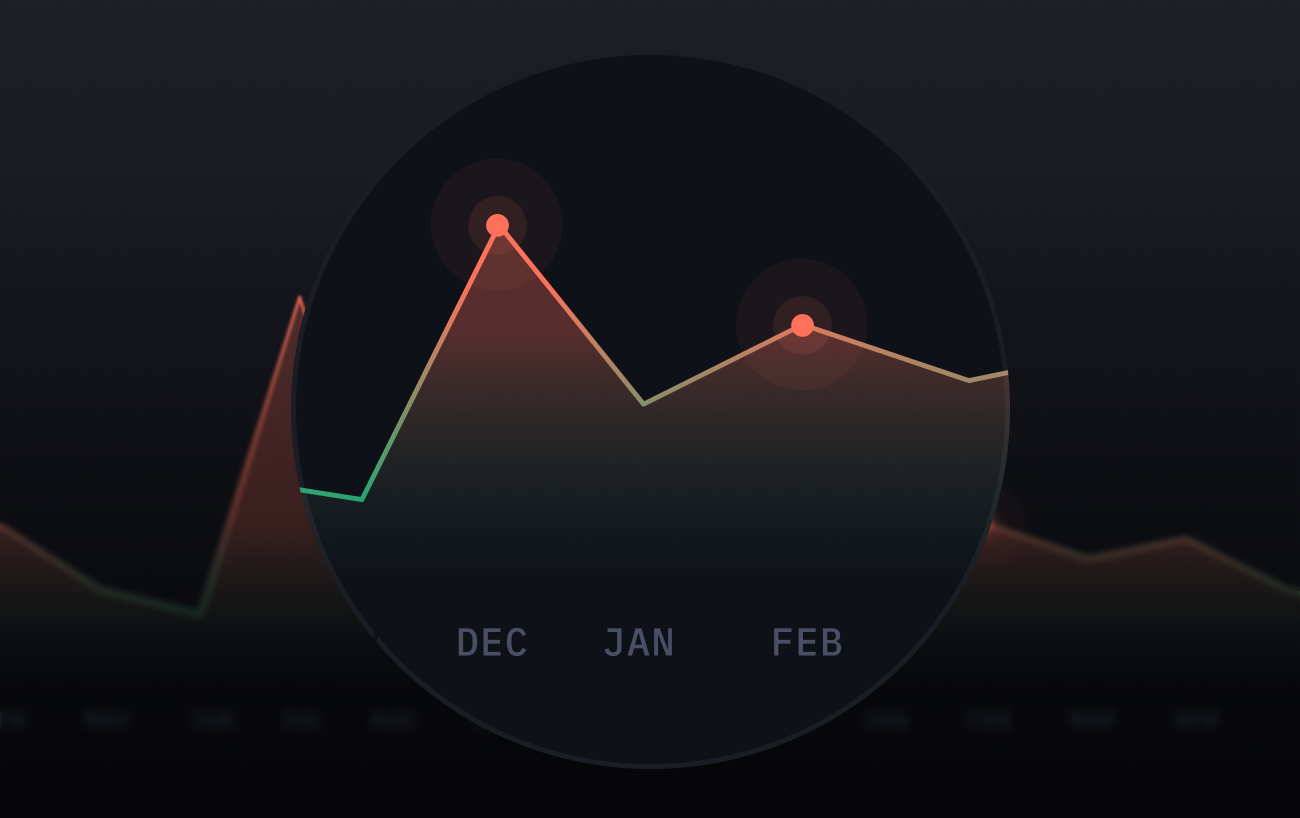
December to Feb Are Also High Churn Intent Months
We see the trend continue over to December to Feb, where churn intent spikes up again. This means people actively go to the cancel button, even though some may change their mind later.
November Is Healthiest Month
November has the healthiest churn. It seems that everybody who cancels is going to wait until December and January to do that. This could make for some interesting consumer behavior insights.
Summer Vacations Impact Retention
July is when customers mentally check out, and actually check out. Seasonality has a huge impact on retention. If you're not prepared with retention flows when customers hit that cancel button, you're losing revenue you could easily save.
What Is Seasonality?
Seasonality is when things happen in predictable patterns that repeat every year. Think Christmas shopping, summer vacations, or new budgets. These patterns show up everywhere, from stock markets to your local retail shop.
Seasonality vs Cyclicality: What's the Difference?
People mix these up all the time, but they're different:
Seasonality happens at the same time every year. Holiday sales spike in December. Ice cream sales go up in summer. Tax software sells more in March and April. Marketers tend to increase ad spend budget around these seasons.
Cyclicality is longer patterns that don't follow the calendar. Economic recessions happen every few years, but not on December 15th every year. Stock market cycles can last decades.
The SaaS churn data from Churnkey is clear seasonality. July spikes happen every single year, even though it may move by a few weeks depending on when people go for holidays.
Seasonality Patterns in Business
Every business has seasons, which depends where they operate and who they serve.
KFC earns 10% of their revenue in the week of Christmas because of a long-standing marketing campaign since the 70s. People associate Kentucky for Christmas.
Holiday seasons can be 30 to 40% of a retailer's entire year. Back to school drives clothing and electronics. Summer pushes outdoor gear.
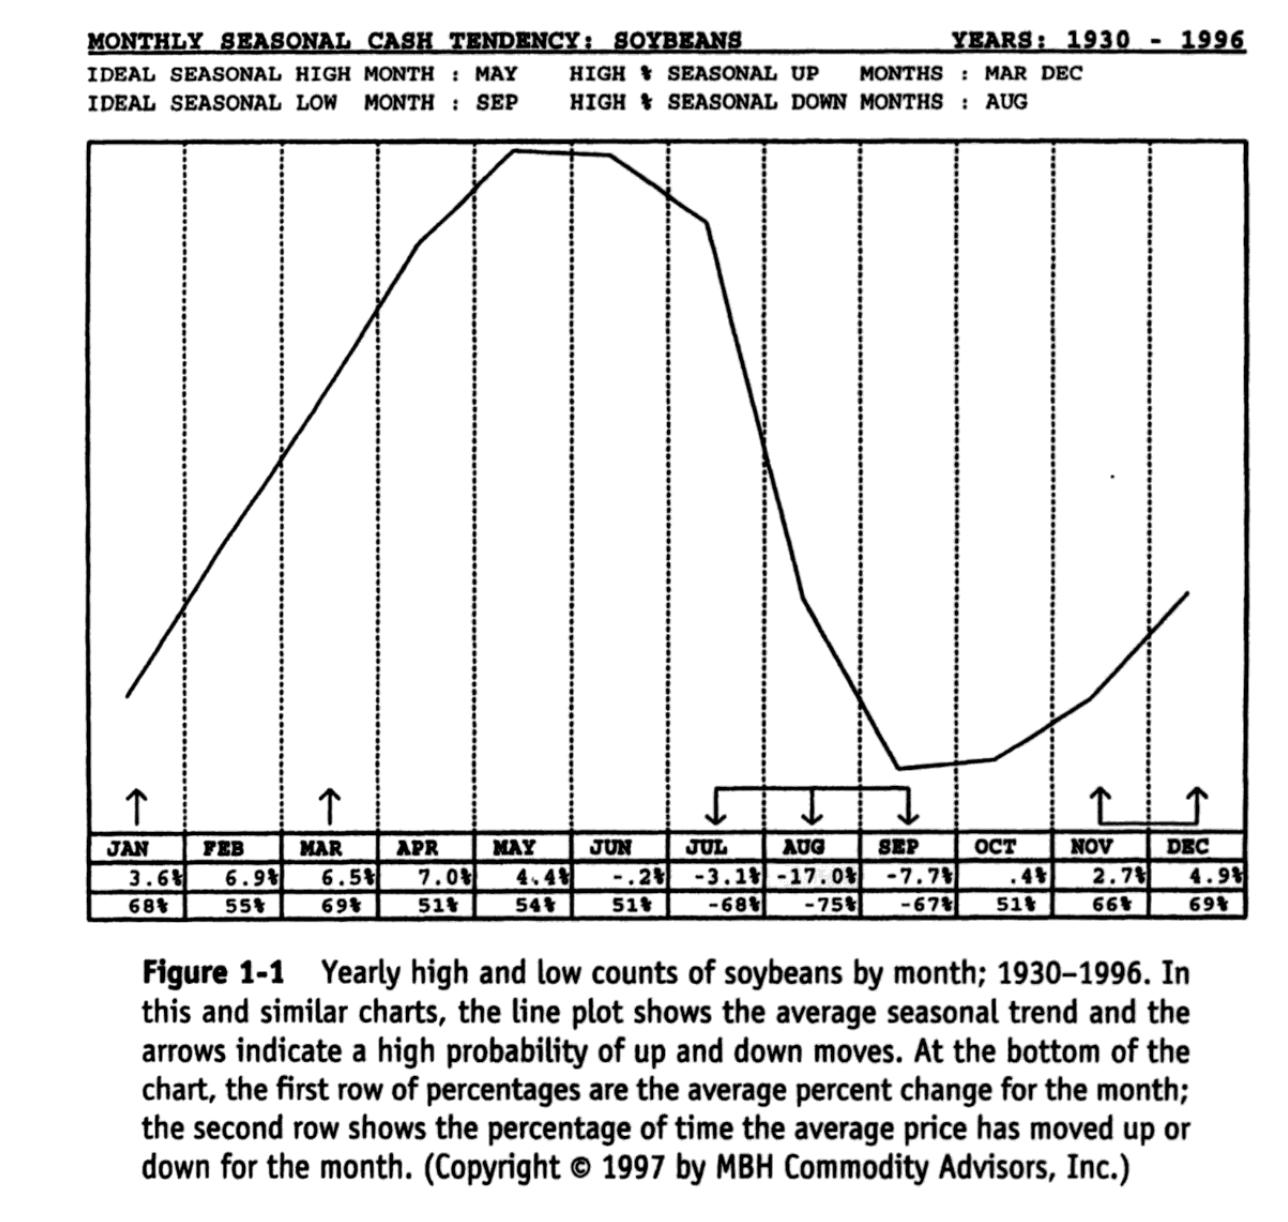
Enterprise business customers often spend leftover budgets in Q4. Q1 is slow while new budgets get approved. Soyabeans is affected by seasonality too.
Seasonality in Time Series Analysis
This is the math behind understanding seasonal patterns.
- Trend: The long-term direction. Is churn going up or down over years
- Seasonal: The repeating pattern. July churn spike every year.
- Random Events: One-time events and noise you can't predict.
Ways to Analyze Seasonality
There are a few ways to analyze seasonality: Moving Averages, Decomposition, ARIMA, and Fourier Methods.
You can watch this video at the 1:56 mark for an easy way to calculate seasonality.
TL;DR: All you need to do is subtract a day's performance to the previous year's. For example, if it's the 300th day of the year. You subtract the sales from 300th day of the previous year.
The ARIMA model has a seasonal aspect to it too, which you can view here.
How to Use Seasonality To Your Advantage?
1. Understand Seasonality
Is it a goverment driven like a policy change or tax-related? Or is it consumer driven like lawn maintenance, snow removal, or ice cream shops.
Many businesses have layers of seasonality:
- Daily patterns within weeks
- Monthly patterns within years
- Quarterly patterns within years
Daily patterns are when people cancel more on certain days and monthly patterns are around your high churn months like July.
Seasonal patterns vary by location. Religious holidays, local traditions, and customs create unique seasonal patterns.
Hover on the chart below to see how holidays differ across regions:
Chart mocked up by Churnkey to showcase holidays differ across regions
2. Get Ahead of Churn
Explore Churnkey's suite of retention products. We help high volume subscription companies recover 20-40% of the revenue that they'd otherwise lose to churn using a host of retention focused products like cancel flows, precision retries, dunning campaigns, and more. Every product is purpose-built to increase your LTV and reduce churn.
3. Manage Inventory
Stock up or before peak seasons. Increase server capacity.
4. Time Your Marketing
Reach out to customers when they're ready to buy. Run well-thought out retention campaigns before high churn months.
5. Manage Cash Flow
Keep more cash during slow seasons. Increase collections during peak periods for example, by encouraging users to switch from monthly to annual.
Technology Is Changing Everything
These days, AI systems can automatically detect and adapt to seasonal patterns.
- Imagine this - if customers churn more suddenly, you can now intelligently offer pauses, discounts, and plan changes.
- Imagine this - What if you could offer the exact offer they needed to stay, that measurably increased LTV?
- Imagine this - You can track sentiment analysis, and adjust offers depending on what season are you in.
- Imagine this - You can run thousands of A/B tests to find what maximizes LTV for your unique business, automatically. You set the guardrails and let AI handle all of the execution.
Manual processes can be time consuming. Automations without personalization aren't as effective, as you probably know.
Now, you can have both: the effectiveness of a manual process and the scale of an automation setup.
Solve Churn With Churnkey
July's 47% churn spike compared to May costs real revenue. December to February spikes and November's healthy retention show clear patterns.
A tiny 1% improvement in monthly churn, can save ~10% annually. This is because churn compounds.
Churnkey will make fighting churn easier and more efficient. We help high volume subscription companies reduce churn using a host of retention products including:
- cancel flows
- precision retries
- feedback AI
- intelligent adaptive offers
- dunning campaigns (SMS + Email)
- pause walls
- and more...
It's free to take a look, so I encourage you to sign up for an account or book a demo.