How do retention dynamics evolve on the path to $100M ARR?
We tested where conventional wisdom holds and where it breaks as companies scale, using data from Churnkey.
Retention bends, breaks, and sometimes reverses as companies grow. What works at $1M often fails at $10M, and problems that don’t exist early on suddenly dominate at scale.
To understand why, we combined the collective wisdom of Lenny Rachitsky, Andrew Chen, a16z, Brian Balfour, and broader academic research with an analysis of billions of dollars in subscription data. Rather than restate conventional wisdom, we tested where it holds and where it breaks as companies scale.
The result is a time-lapse of how retention actually evolves from under $1M to $100M+ ARR.
- showing where consumer and B2B paths diverge
- when churn improves or worsens
- why NRR stays deceptively stable, and
- which risks only appear after you’ve already won
All of this is compressed into seven key insights on the path to $100M ARR.
The Seven Key Insights of Retention
I. Retention Worsens at Scale (For Some)
Andrew Chen says: "Retention gets worse as users expand and grow. The best users are early and organic. The worst users come after that."
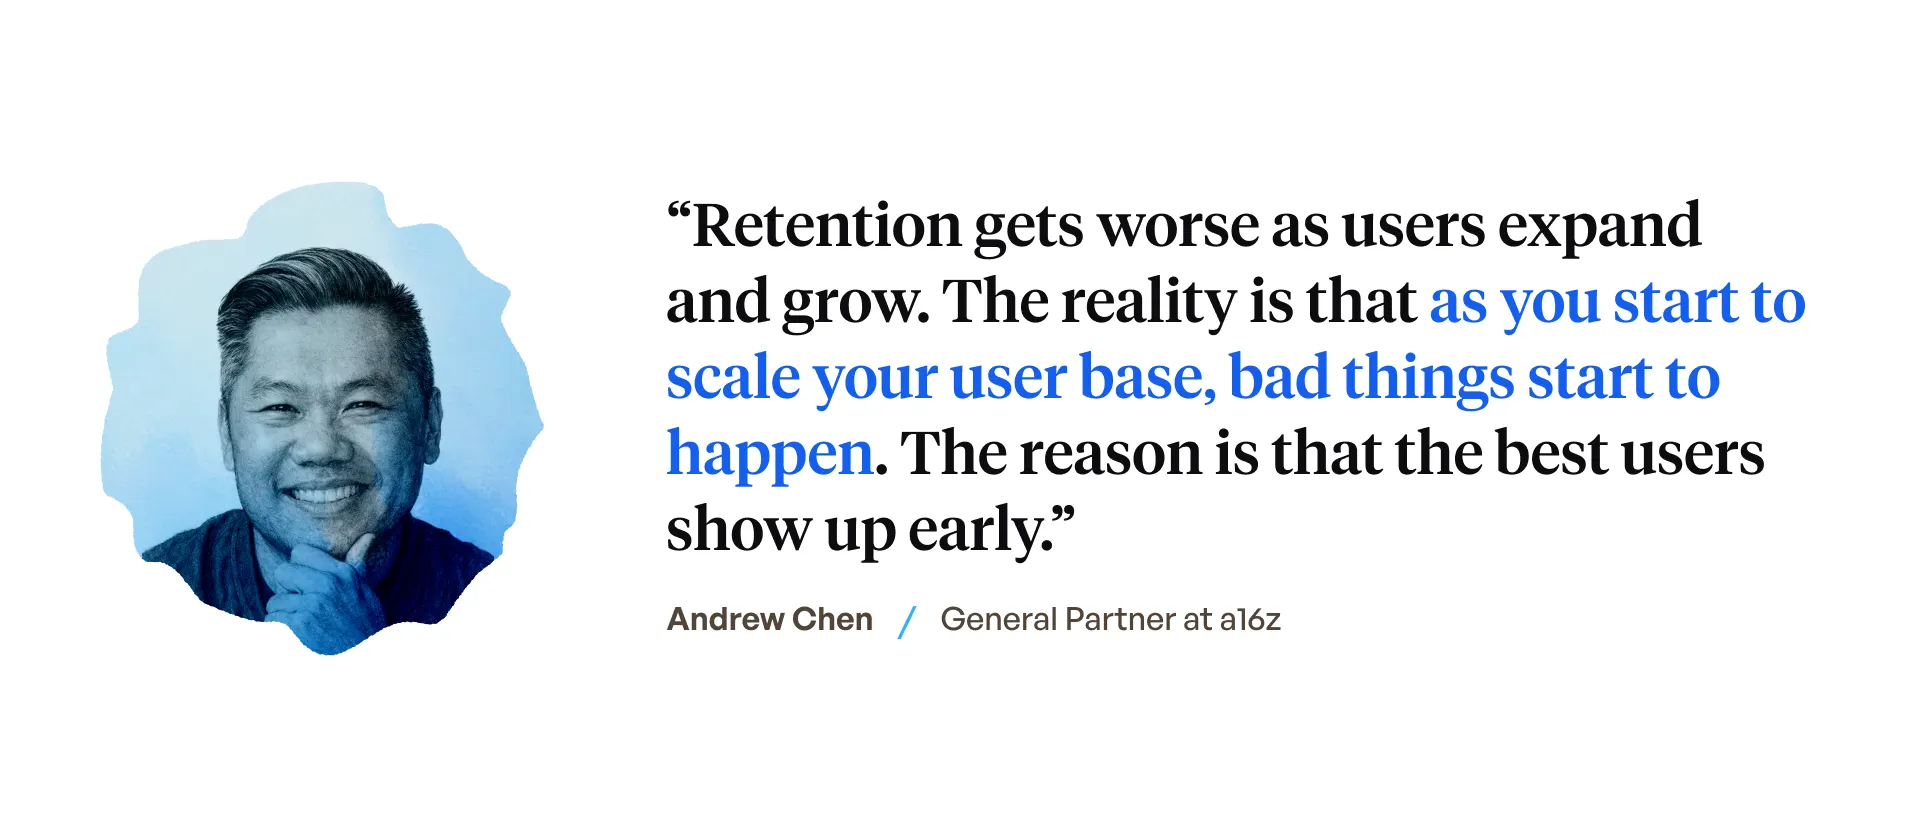
Churnkey data says: This is only half true, and the other half changes everything.
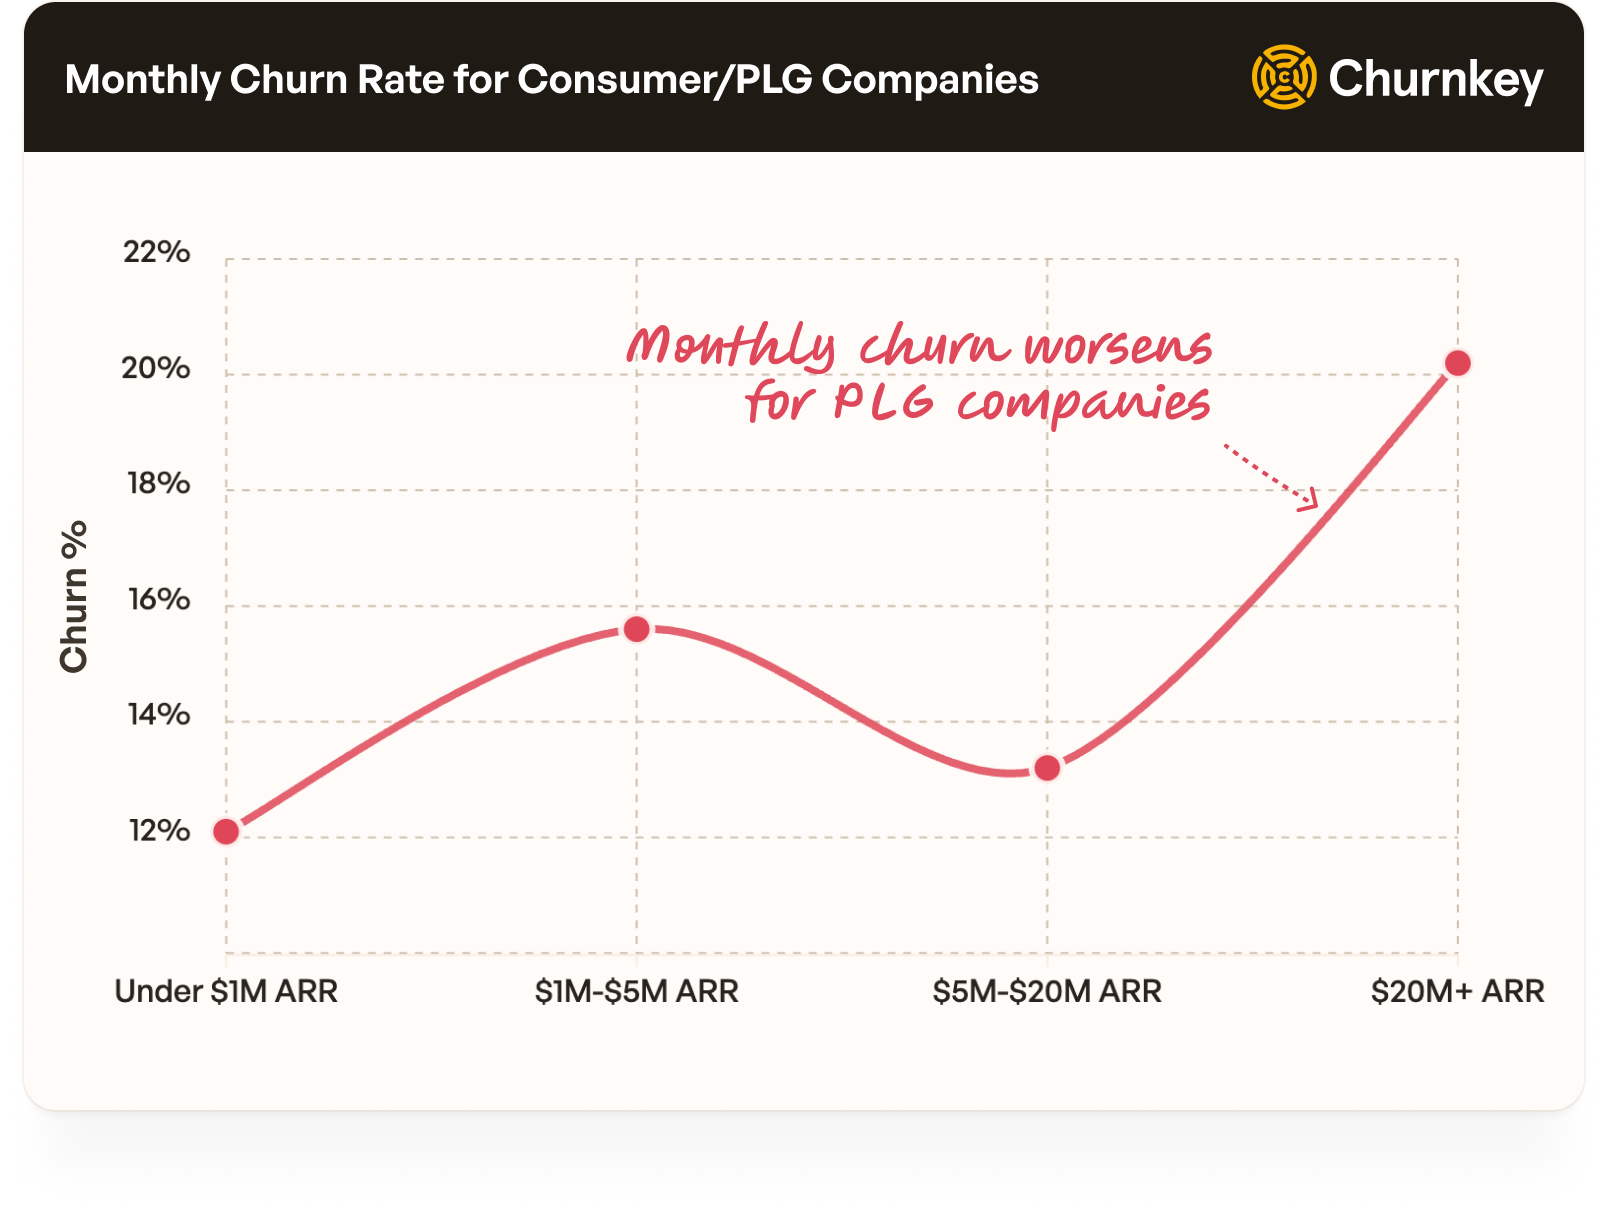
We sampled half a million subscribers who pay less or equal to $20/month. Consumer companies follow Chen's law perfectly. Churn worsens from 12.1% (under $1M) to 20.2% (at $20M+ ARR+).
But B2B SaaS that charge $20-$100/month completely invert this pattern. Retention gets better as companies scale. Churn drops at scale.
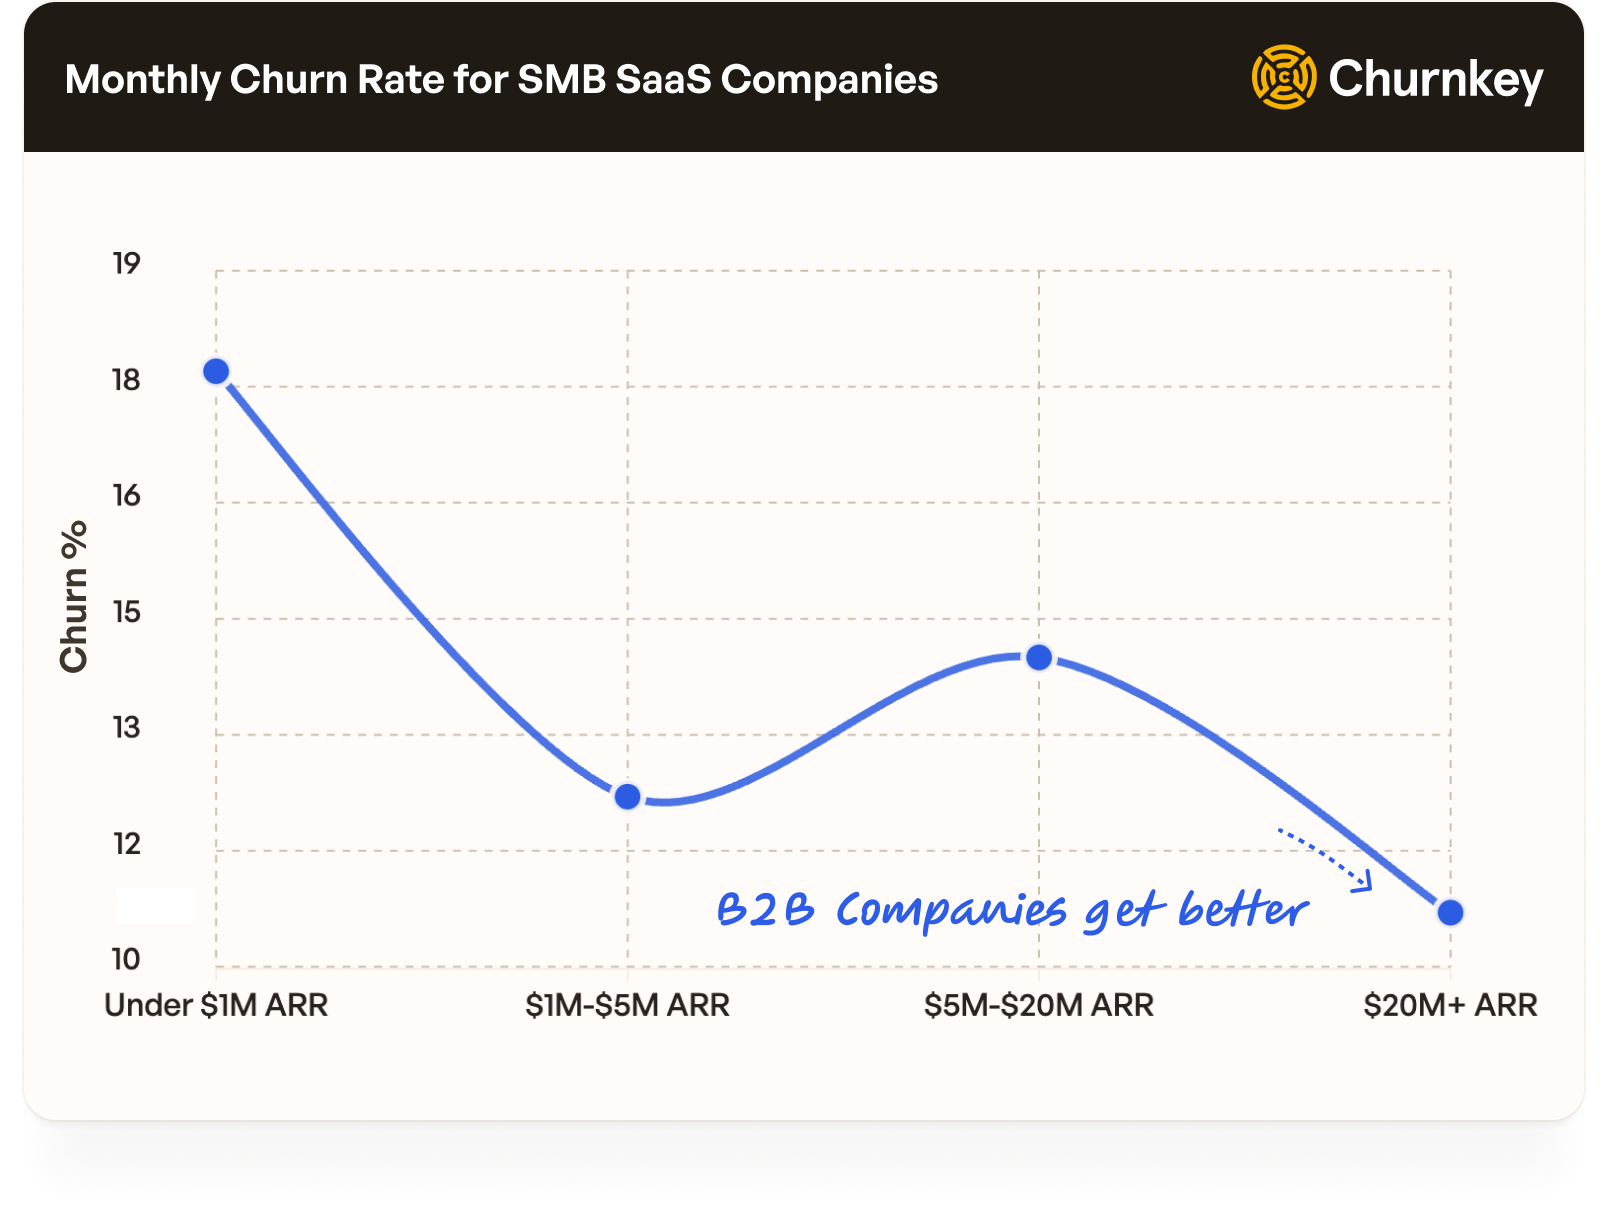
The Key Insight:
While B2C companies get worse as they scale, B2B companies get better at retention as they scale. If you’re selling subscription products lower than $20/month, churn could get worse.
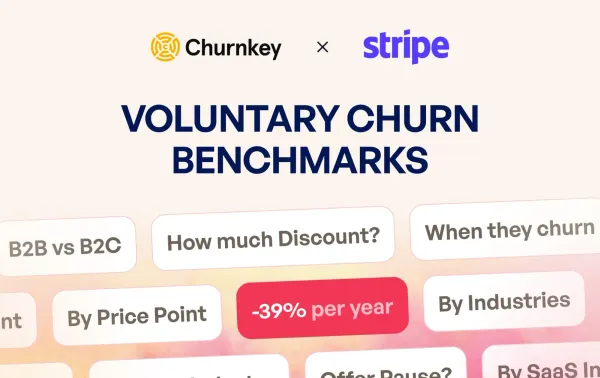
II. Net Revenue Retention Remains Relatively Stable
Casey Winters says in Lenny’s Newsletter: “Great retention is the scalable way to grow a product”. They benchmark net revenue retention. NRR includes expansion revenue from existing customers.
Churnkey data reveals something extraordinary.
NRR remains remarkably stable across every scale milestone. Which means, as a company scales, their NRR doesn’t change much.
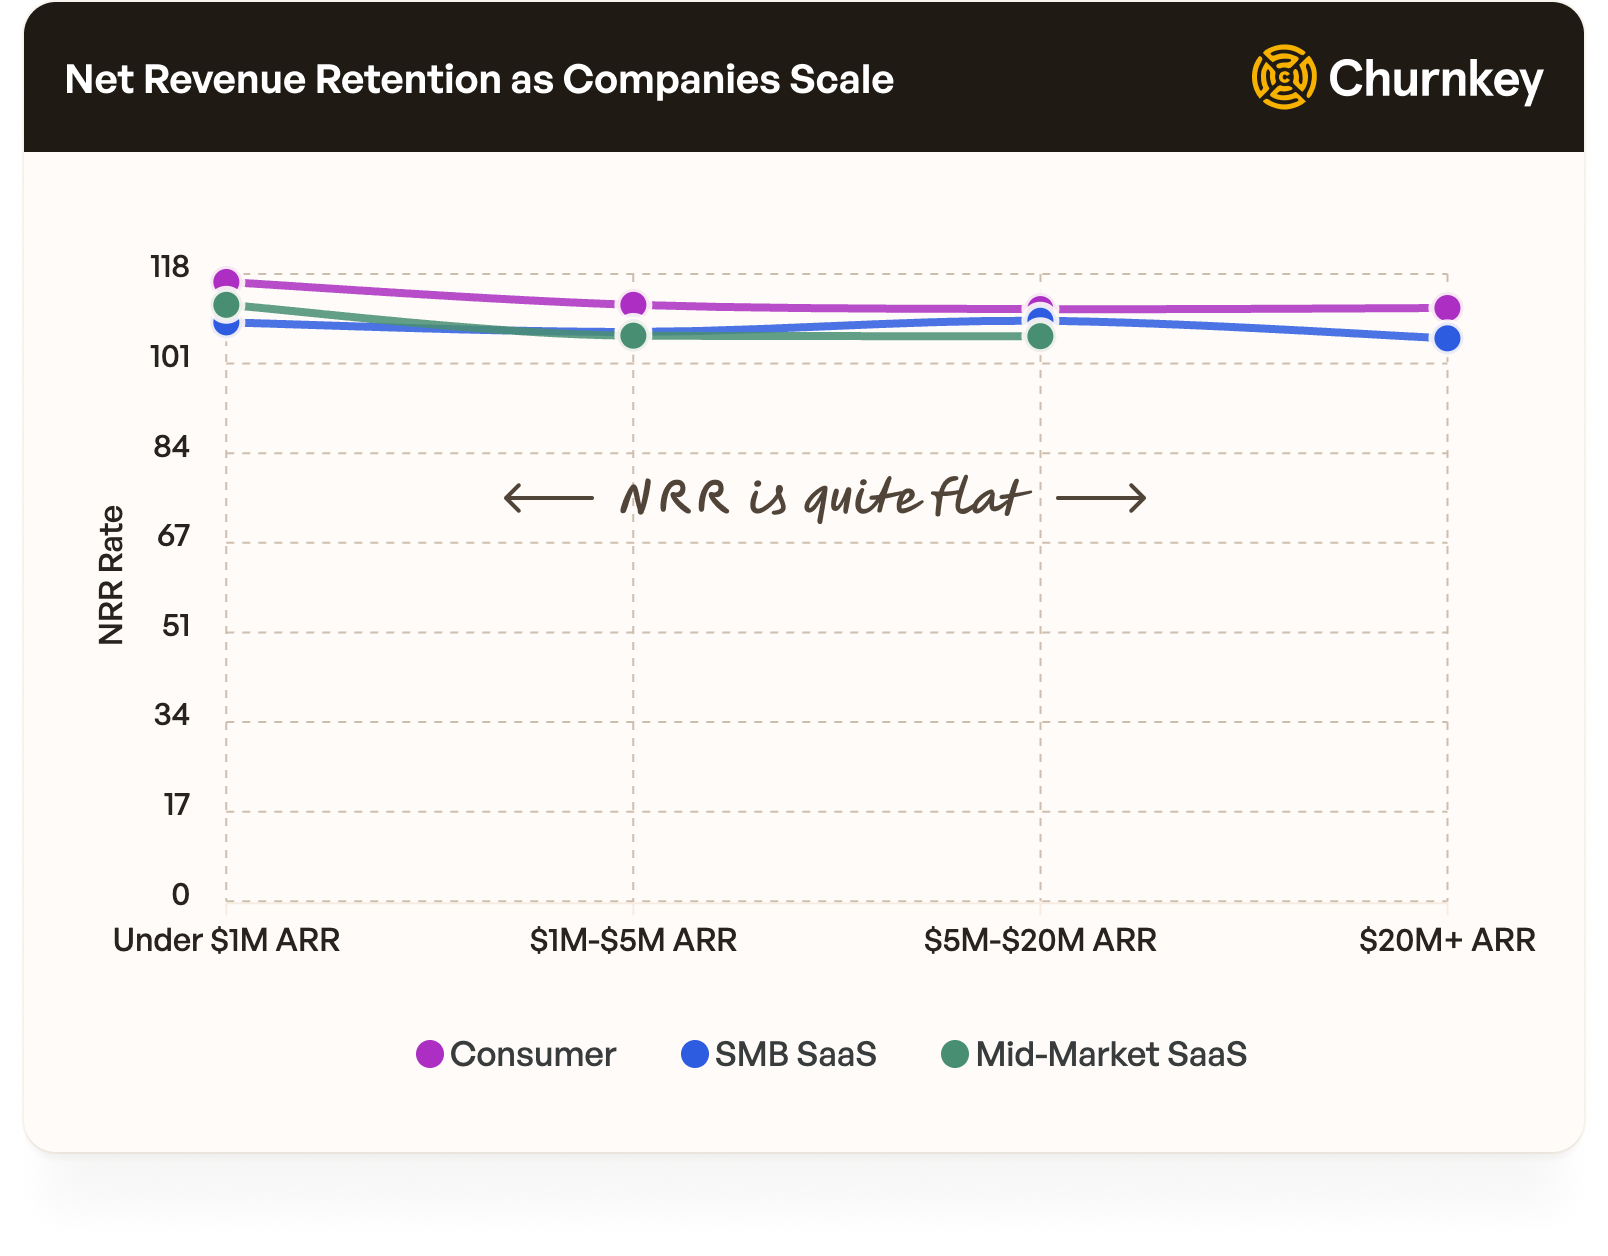
Andrew Chen also writes that retention does decay over time. This is true but it isn’t as severe as you may think.
Consumer companies drops by just 5% from under $1M in ARR to over $20M in ARR. Whereas, SMB SaaS companies drop by just 3%.
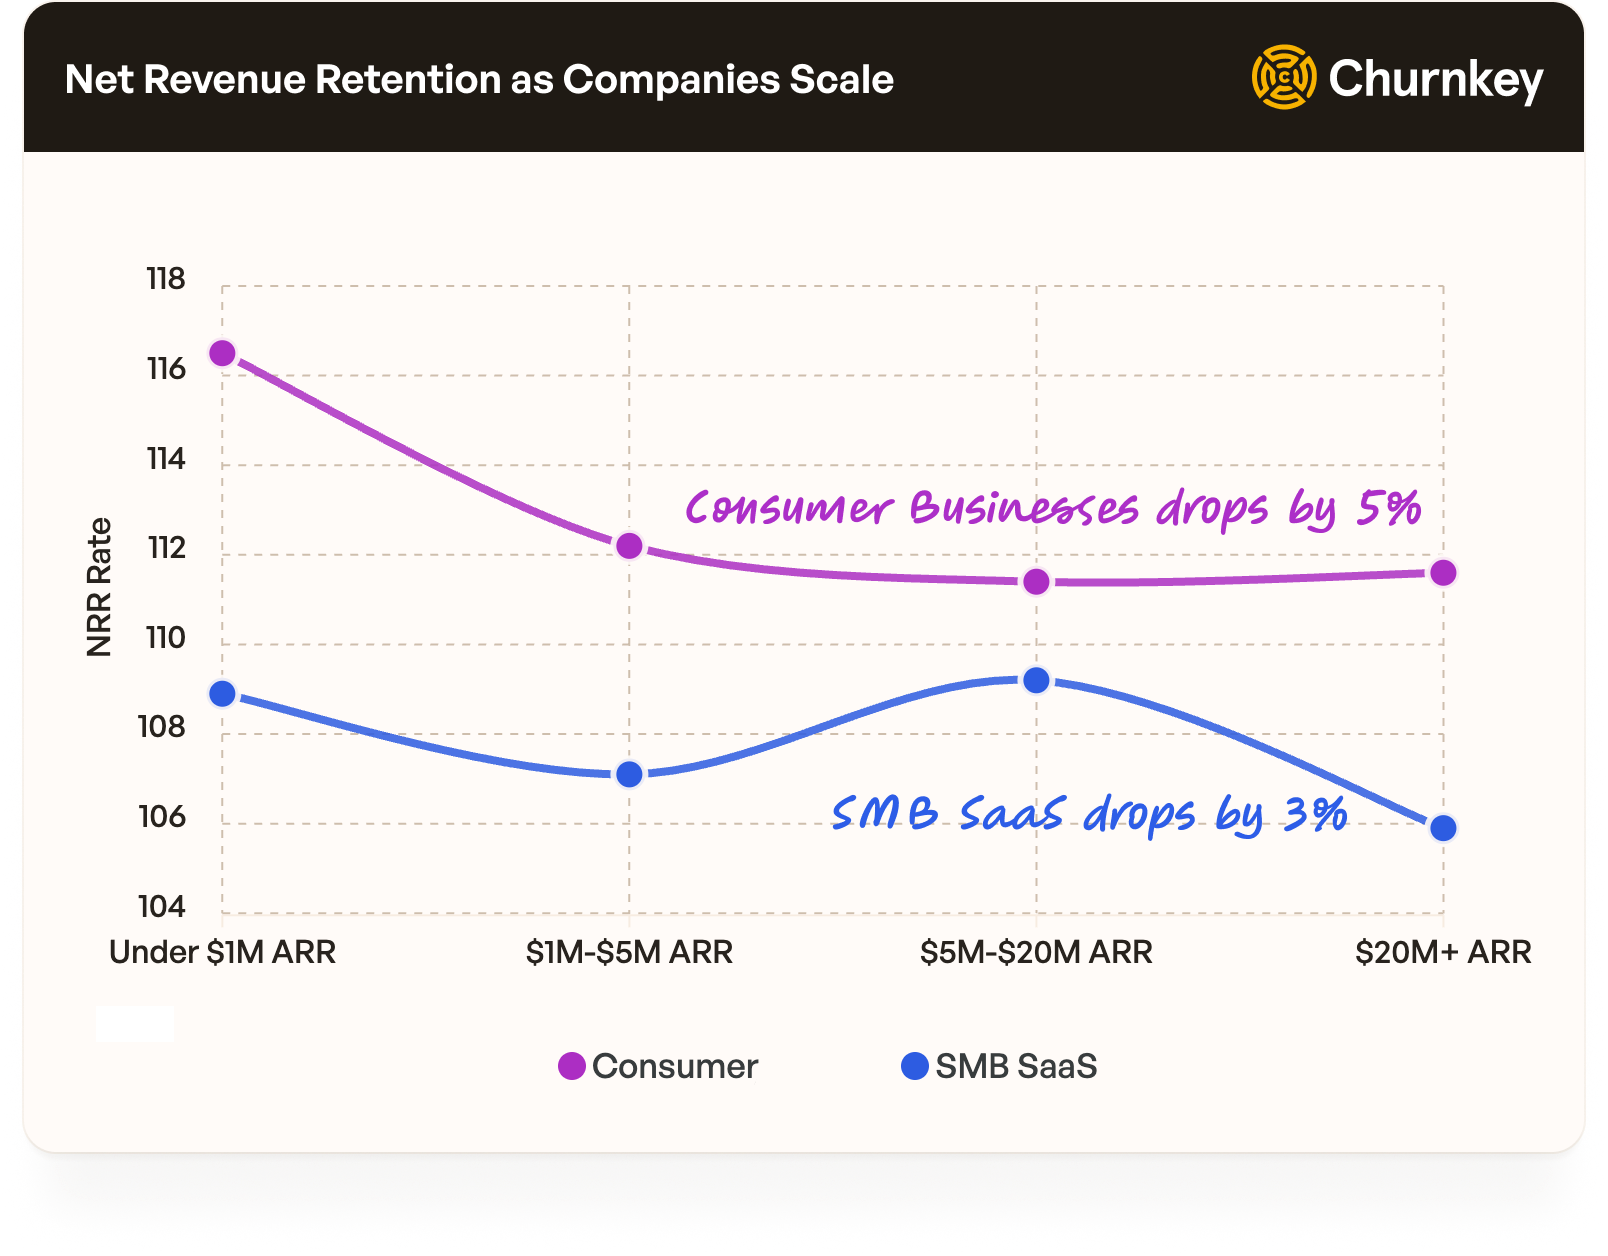
When we dig deeper, we see that that consumer companies lose a lot more customers but they quickly make it up with existing customers who expand usage.
Look at the comparison chart below for consumer companies.
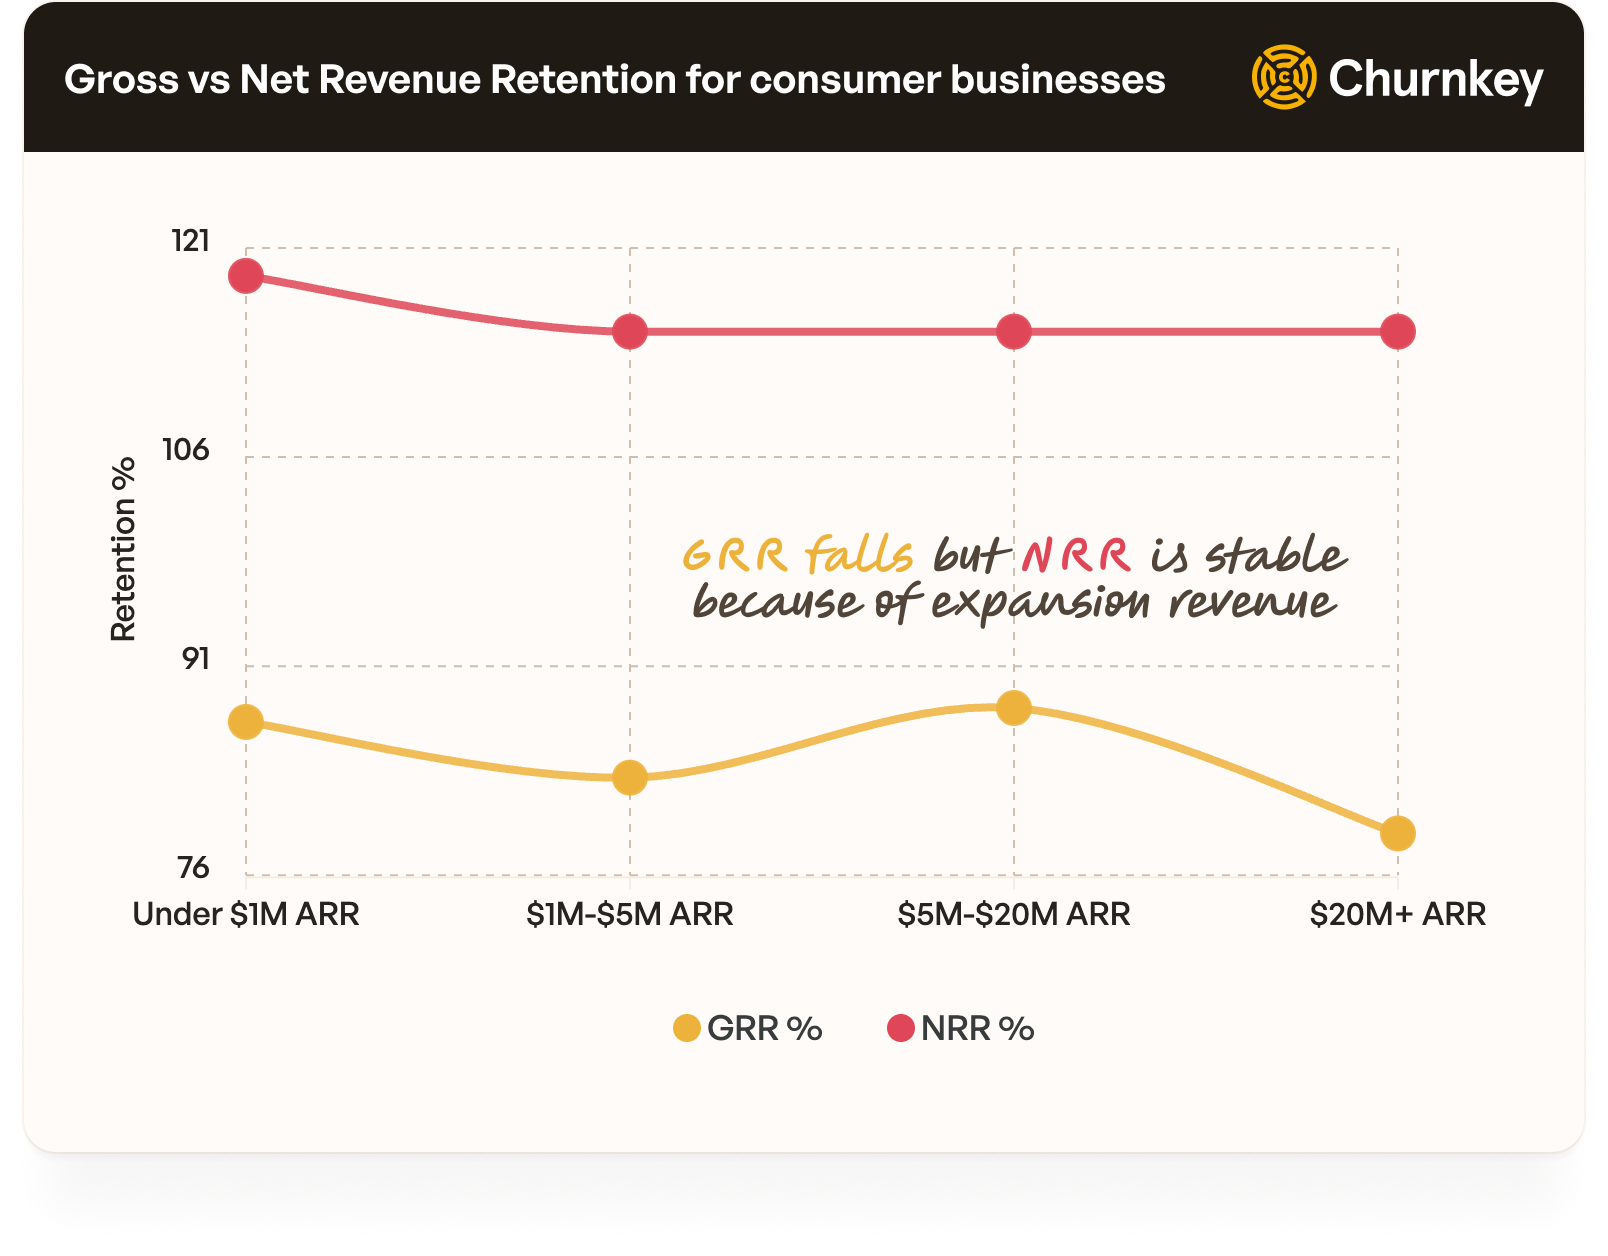
Gross revenue retention is a strict metric. It accounts for churn and contraction. But excludes expansion revenue. That’s why we see GRR fall as companies scale, but NRR is relatively stable.
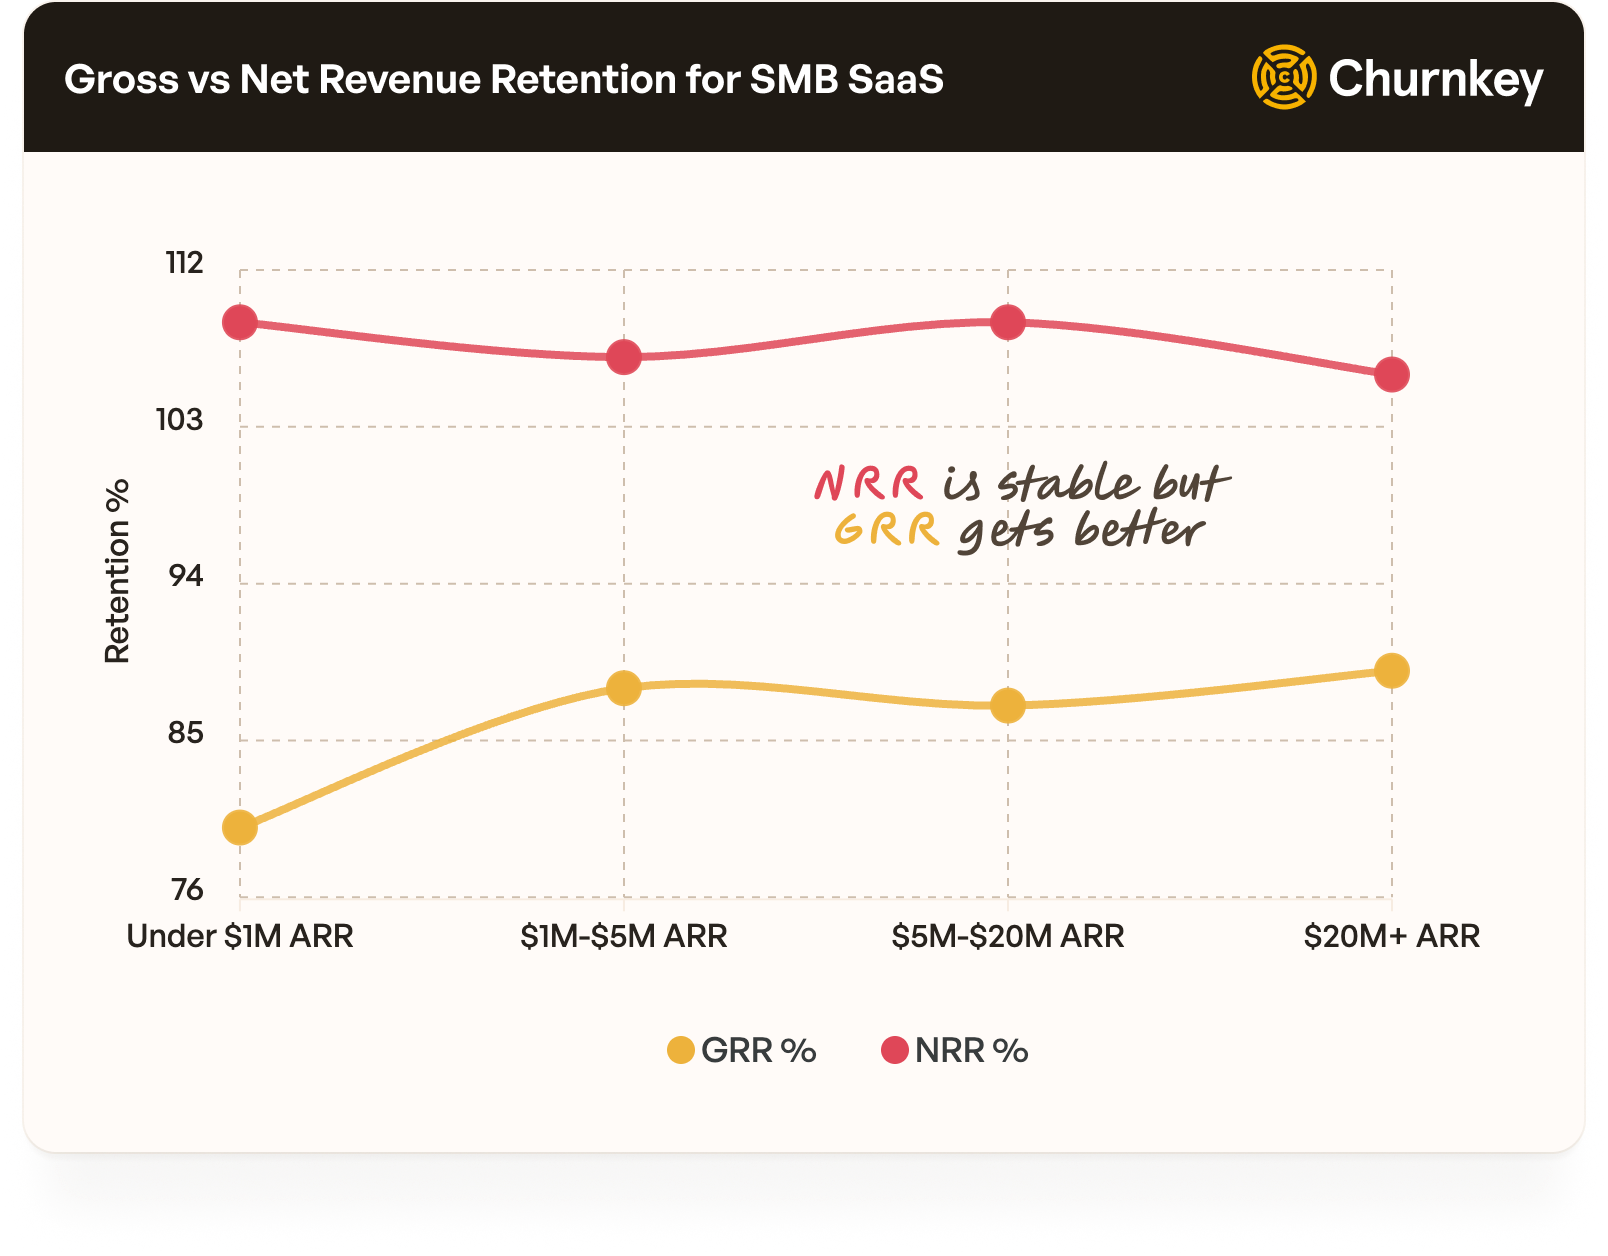
But for SMB companies, it’s different.
Users are stickier. NRR is stable, just like consumer companies. But GRR actually gets better as you scale. This means, your users stick around for longer but they don’t expand as much.
The Key Insight:
NRR is an important metric. But where that revenue is coming from is equally important to look at. Is it from existing users or new users? Are you optimizing this incorrectly?
Many companies add friction to artificially improve NRR. But the data shows that consumer companies would earn more by expanding customers in the long-run. So, you can get away with a lower GRR but have a healthier NRR.
Take a look at this clip from Shopify’s Head of Growth: they optimize for churn. And it’s for the same reasons we discussed above.
We’ve compared Churnkey’s performance to that of Lenny’s benchmarks. On average, companies that use Churnkey see an additional boost of 7-16%, compared to Lenny’s.
| Benchmark Source | Bottom Up SaaS NRR |
|---|---|
| Lennys Benchmarks | 100% is good |
| Churnkey Averages | 107–116% is standard |
Churnkey uses a host of features like cancel flows, precision retries, dunning campaigns to ethically improve retention.
A note to existing Churnkey customers:
Layer all the products Churnkey has to offer. The more products you use, the better performance you will see.
If you aren’t using Churnkey yet:
We hope you’ll have the time to check out the product. Take a demo or sign up for a trial account.
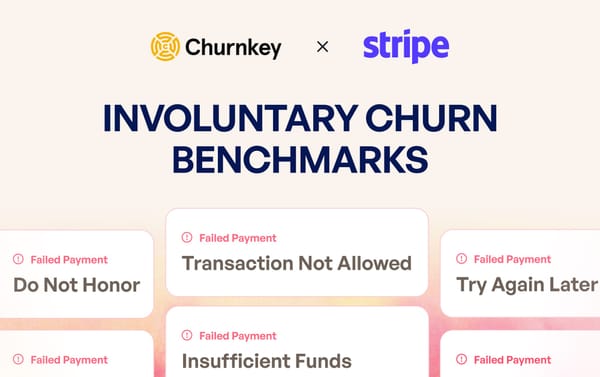
III. Fear the Hidden Tax of Failed Payments
Involuntary churn happens when payments fail silently like insufficient funds, do not honor, or stolen card.
As Elena Verna shares, “Involuntary churn isn’t usually a huge issue for monthly subscriptions in early terms - unless you have a large base of debit card users, which are more prone to failed payments.”
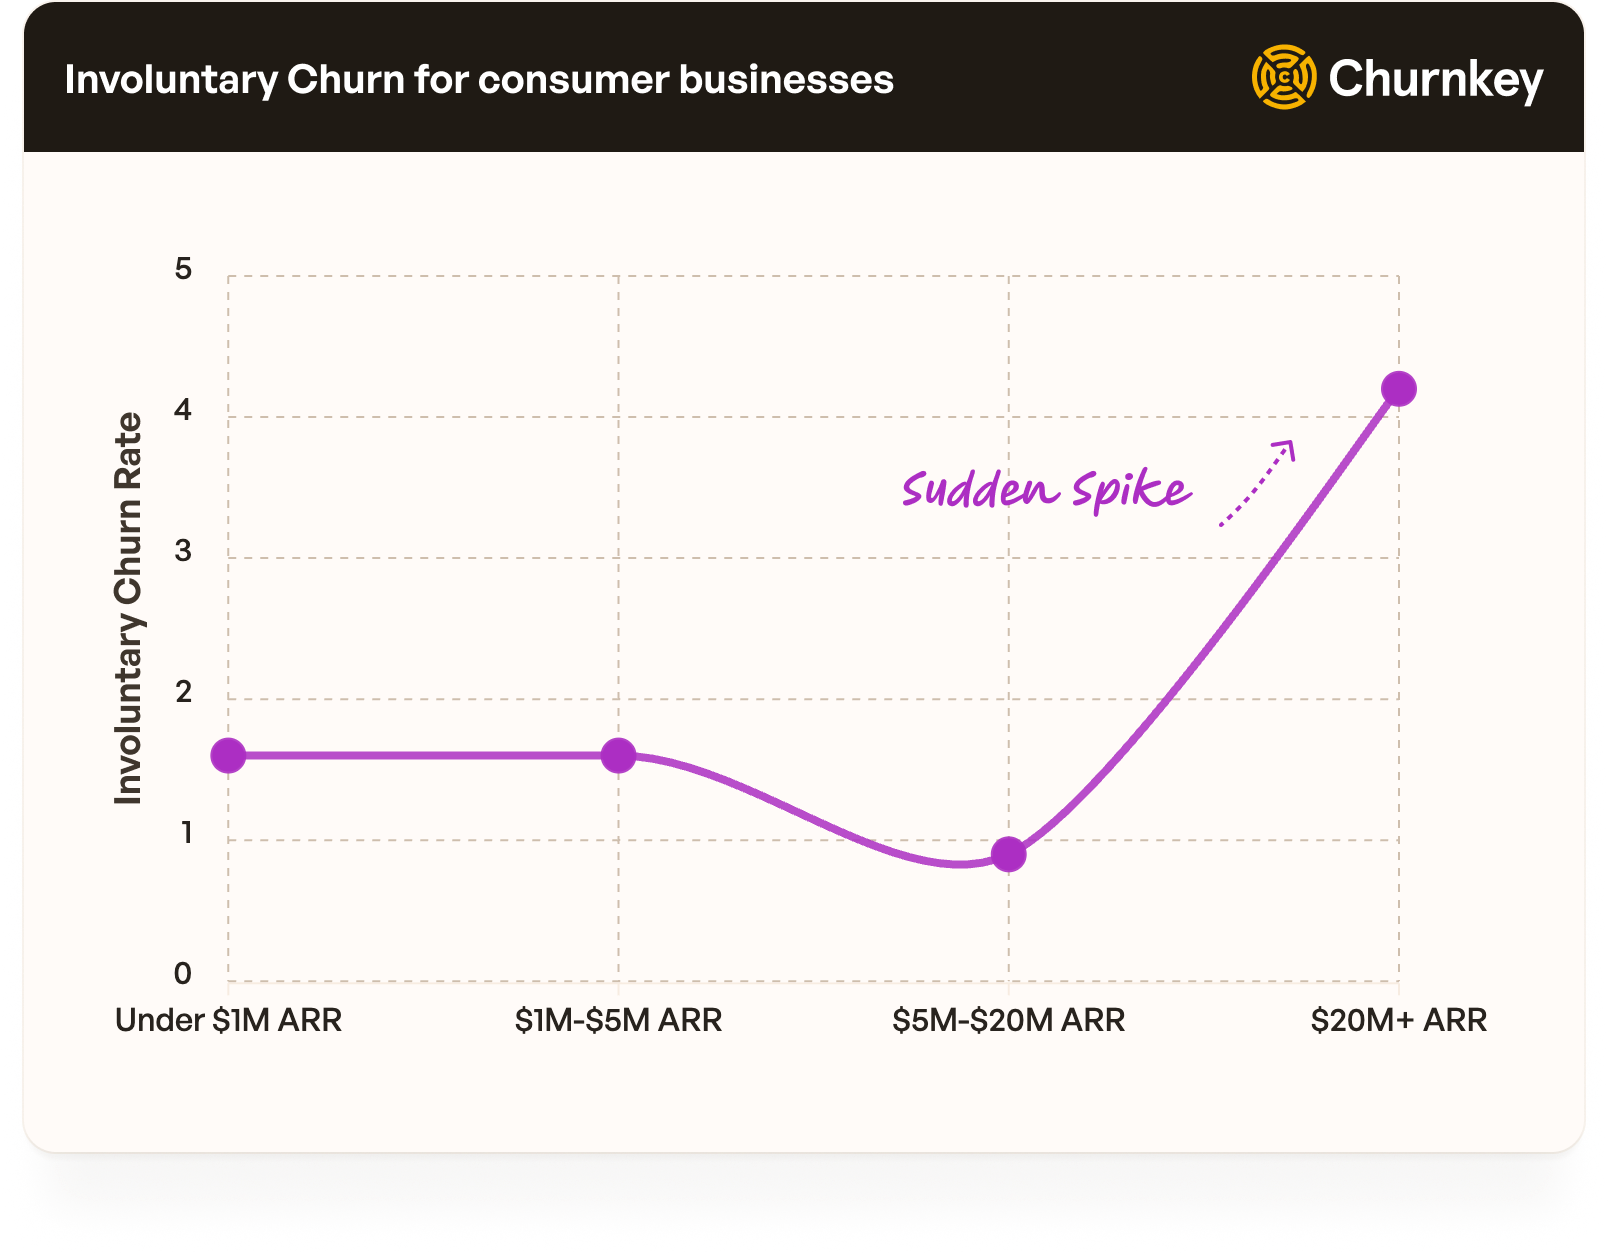
Churnkey data shows: This is true for most businesses, especially so with consumer businesses.
Once you cross a certain revenue milestone, involuntary churn spikes. After a certain stage, companies even set up dedicated teams to manage involuntary churn.
Our report on involuntary churn with Stripe shows that B2C companies see similar churn rates. However, B2C companies lose more to involuntary churn than B2B counterparts.
| Business model | Annual churn rate | Annual involuntary churn rate | Involuntary churn as a % of overall churn |
|---|---|---|---|
| B2C | 39% | 9% | 24% |
| B2B | 38% | 6% | 16% |
As Elena says, “you should be recovering at least 50% of these failed payments through your retry logic (automatic retries, card updaters, smart dunning flows, etc.).”
In 2024, Churnkey recovered 70% of all involuntary churn detected (one of the highest recovery rates in the industry). This was the average. Which means, half of the companies saw better recovery rates than 70%.
The Key Insight:
Keep a pulse on involuntary churn. It’s a low hanging fruit since setup requries zero engineering lift. Your billing provider may already have a basic solution built in. Layer on Churnkey’s Precision Retries and/or have dedicated team members for an additional boost once you hit scale.
A note to existing Churnkey customers:
Software is best complemented with strategy. We recommend that you reach out to your account manager and use the account agent to get tailored advice on how to improve recovery rates.
IV. Escape the Chaos of Early-Stage Variance
Brian Balfour says: "Never benchmark against averages. The average company fails."
Churnkey data shows why: Early-stage churn variance is massive, then collapses as companies mature.
Consumer companies can see low churn. Best in class see 1.3% monthly churn. But you can see churn as high as 30%. So, it can vary a lot.
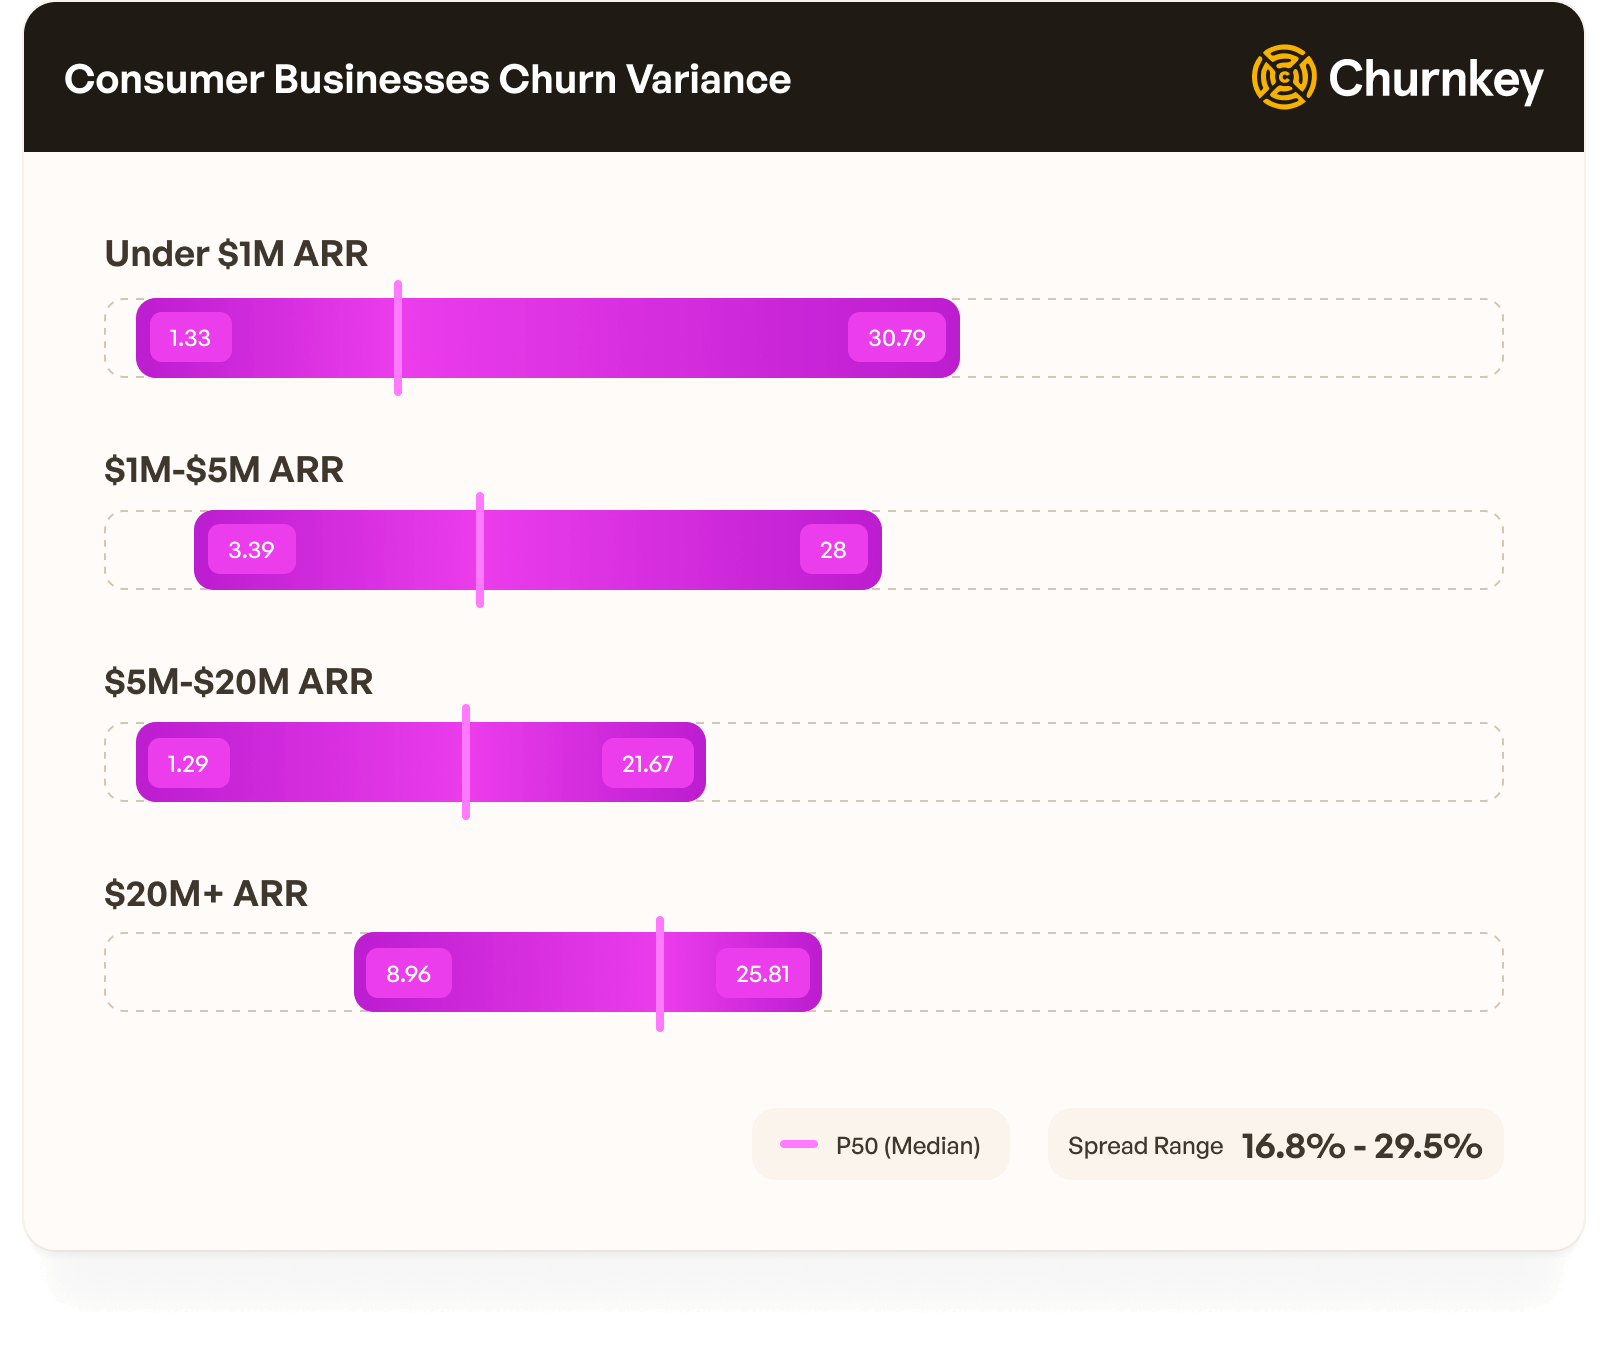
The range differs by they type of company. But it always improves.
The good news is that early stage consumer companies can see churn as low as 1.3%/month. Top 10% of companies at Churnkey experience this magical churn rate.
The Key Insight:
Averages and medians don’t reveal variance. Look at the variance and see if you can be the top 10% of that cohort.
V. People Leave For Different Reasons As You Scale
Conventional wisdom: "Price sensitivity decreases as you move upmarket."
This is true but with some caveats.
Price sensitivity worsens from $1M to $5M-$20M ARR (24% → 34%), then stabilizes at scale.
You struggle the most in the middle, not at the beginning.
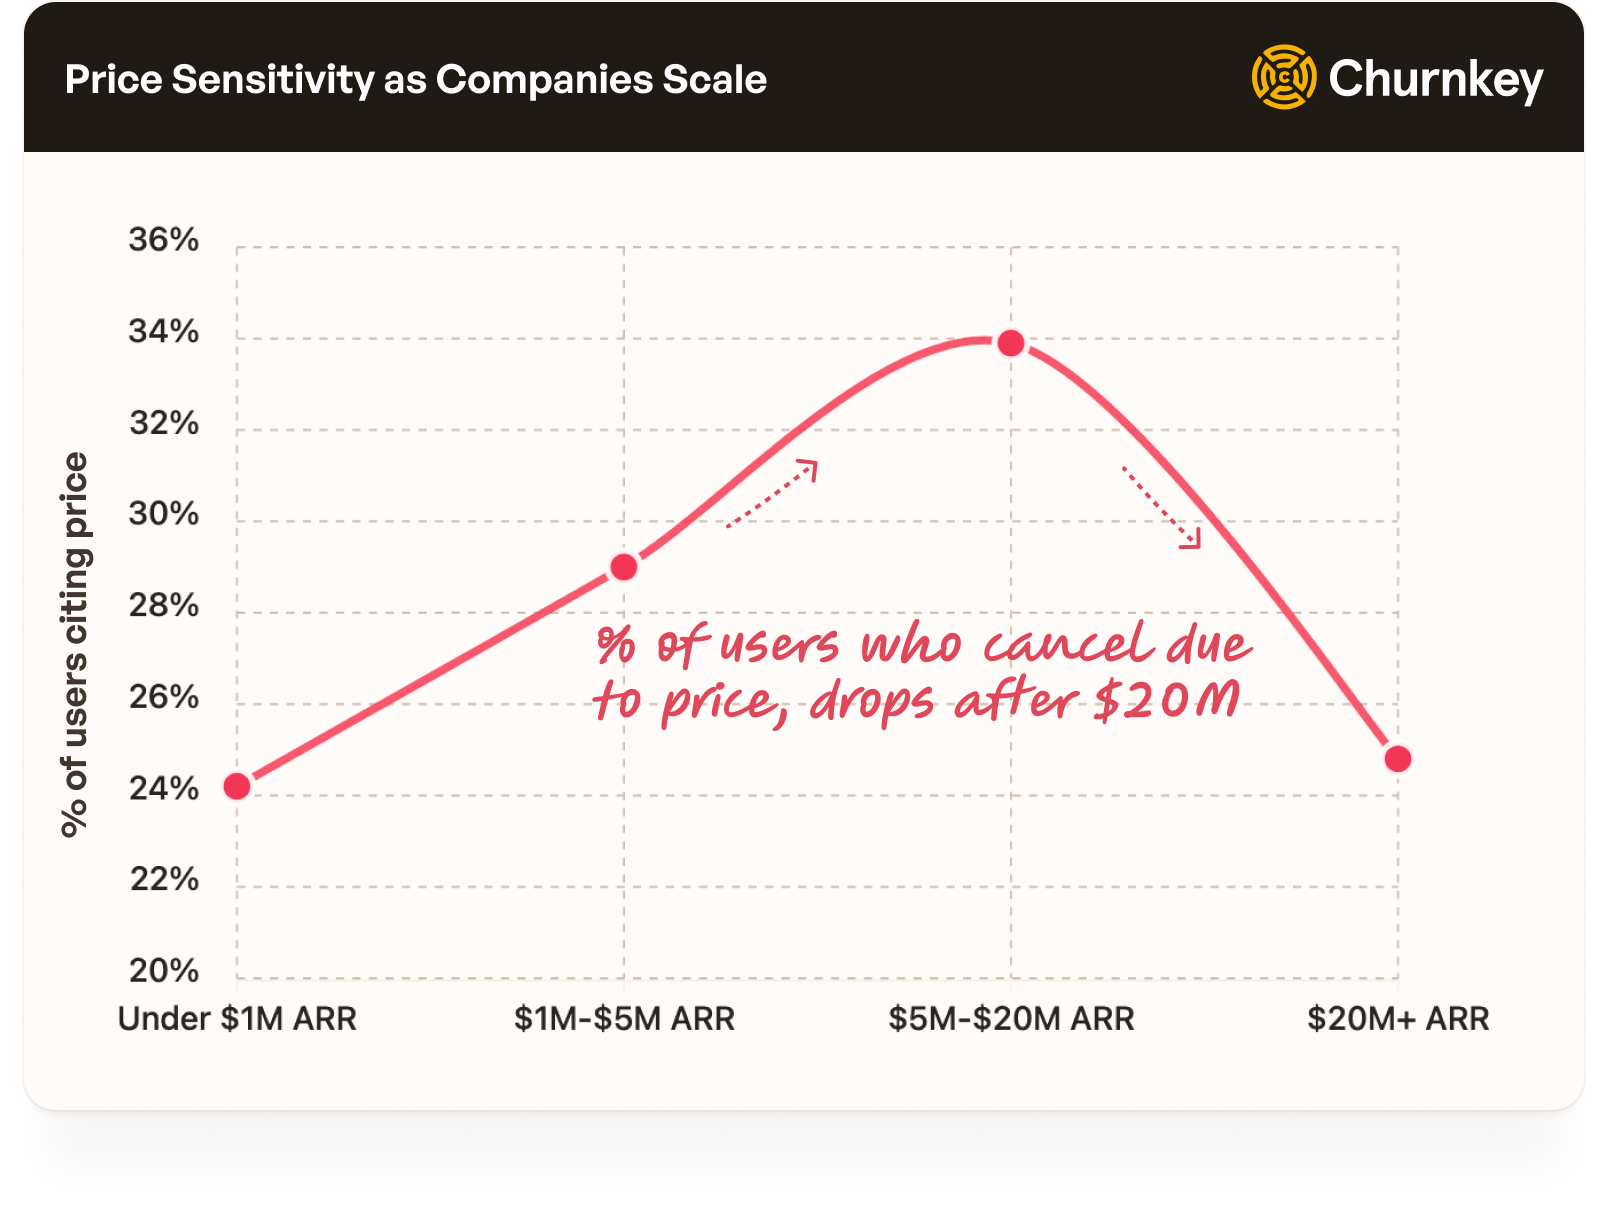
Why this happens:
- Under $1M: Early adopters who evangelize your product. They are price-insensitive champions.
- $1M-$20M: You're acquiring budget-conscious mainstream customers to hit growth targets.
- $20M+: You've finally built enough brand and features that value justifies price.
The reason, “no longer needed” also follows a similar trend.
Compare this to SMB SaaS: Price sensitivity worsens as you scale. At $20M+, 40% cite price (vs 24.8% for Consumer).
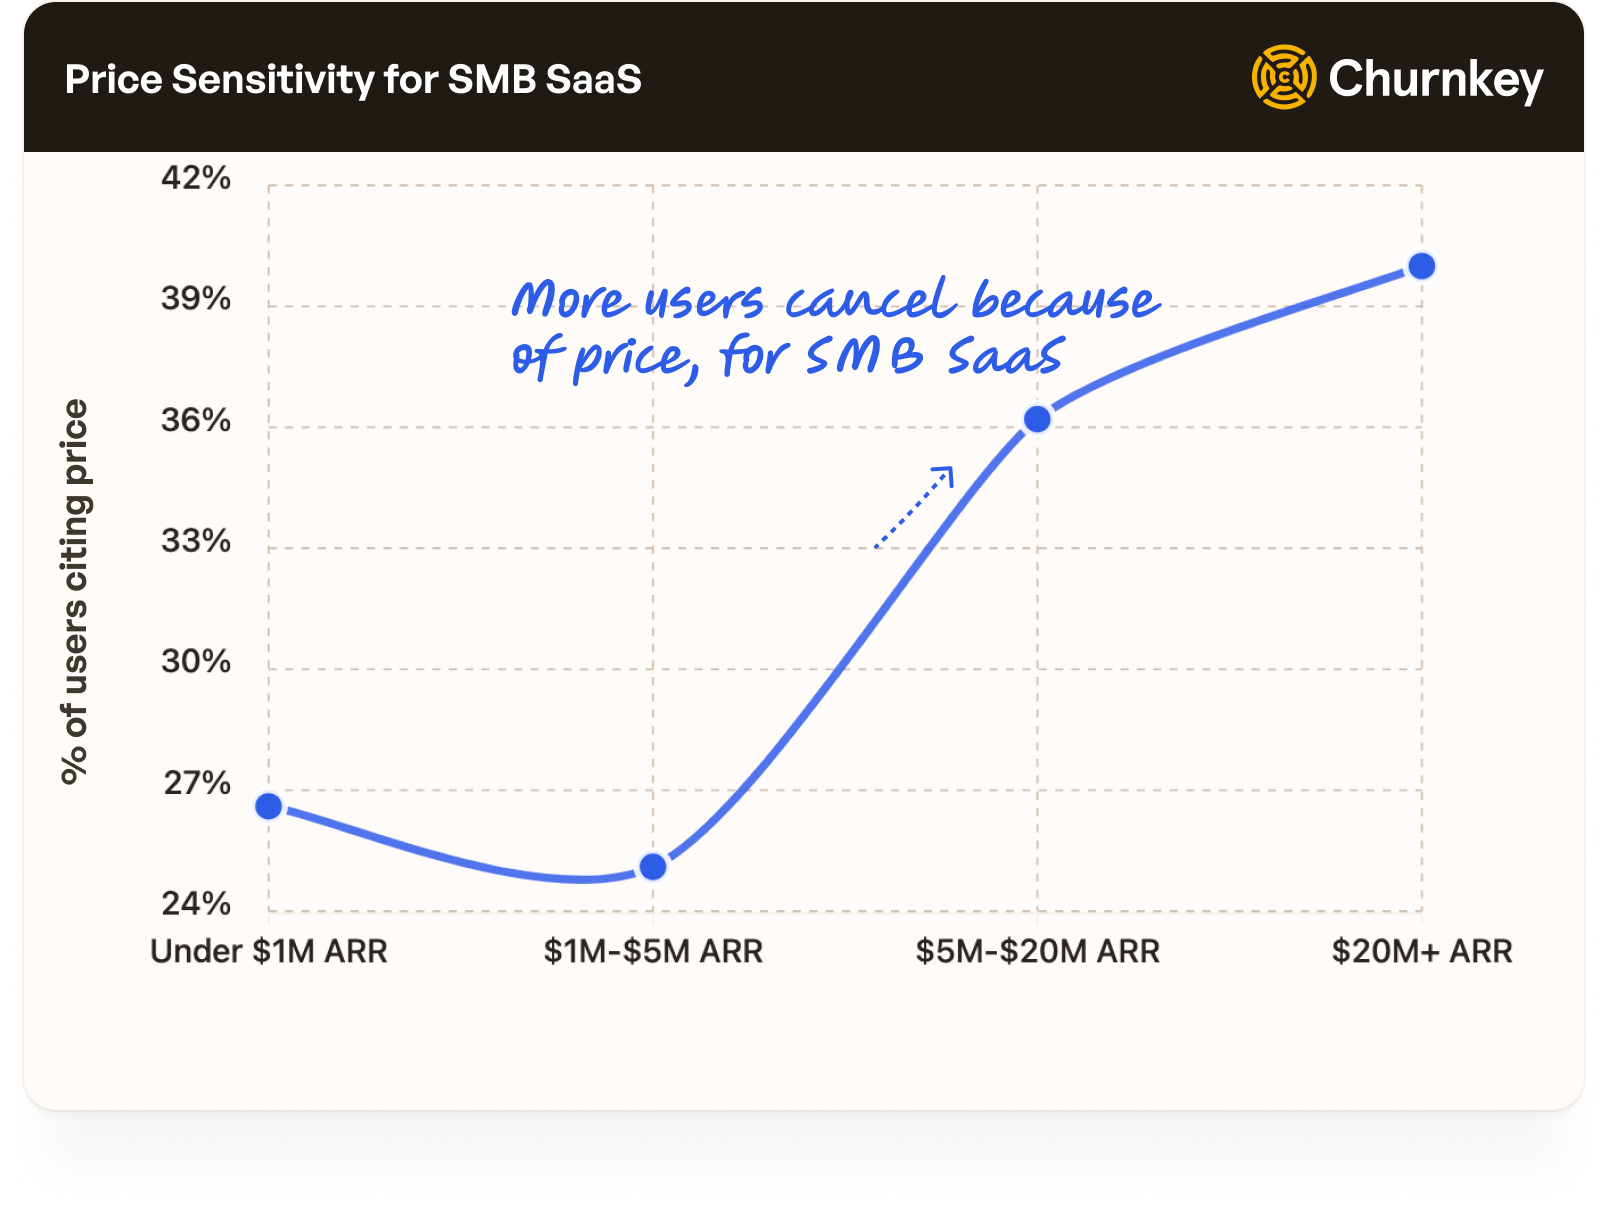
This is because SMBs are businesses buying tools. Economic downturns hit them. They constantly evaluate ROI. There's no "brand love" to insulate you from spreadsheet analysis.
The Key Insight:
For consumer companies, the journey from $1M to $20M is a battle through budget-conscious users before you earn pricing power. For SMB SaaS, you're in a perpetual price war that intensifies with scale. Only Mid-Market and Enterprise escape this trap.
VI. Alternative Solutions Arrive Fashionably Late
a16z says: “First to market seldom matters. Rather, first to product/market fit is almost always the long-term winner. Once a company has PMF it still must find a sustainable growth model and create a moat against competitors and so on.”
Conventional wisdom doesn’t doesn't address when competitors flood your category.
Churnkey data reveals the exact moment competitors matter:
Alternative solutions are nearly zero for all models under $5M ARR. Competition for your customers only becomes a significant churn factor after you've proven product-market fit.
Alternative solutions are irrelevant until $20M ARR, then they 75x overnight for consumer businesses.
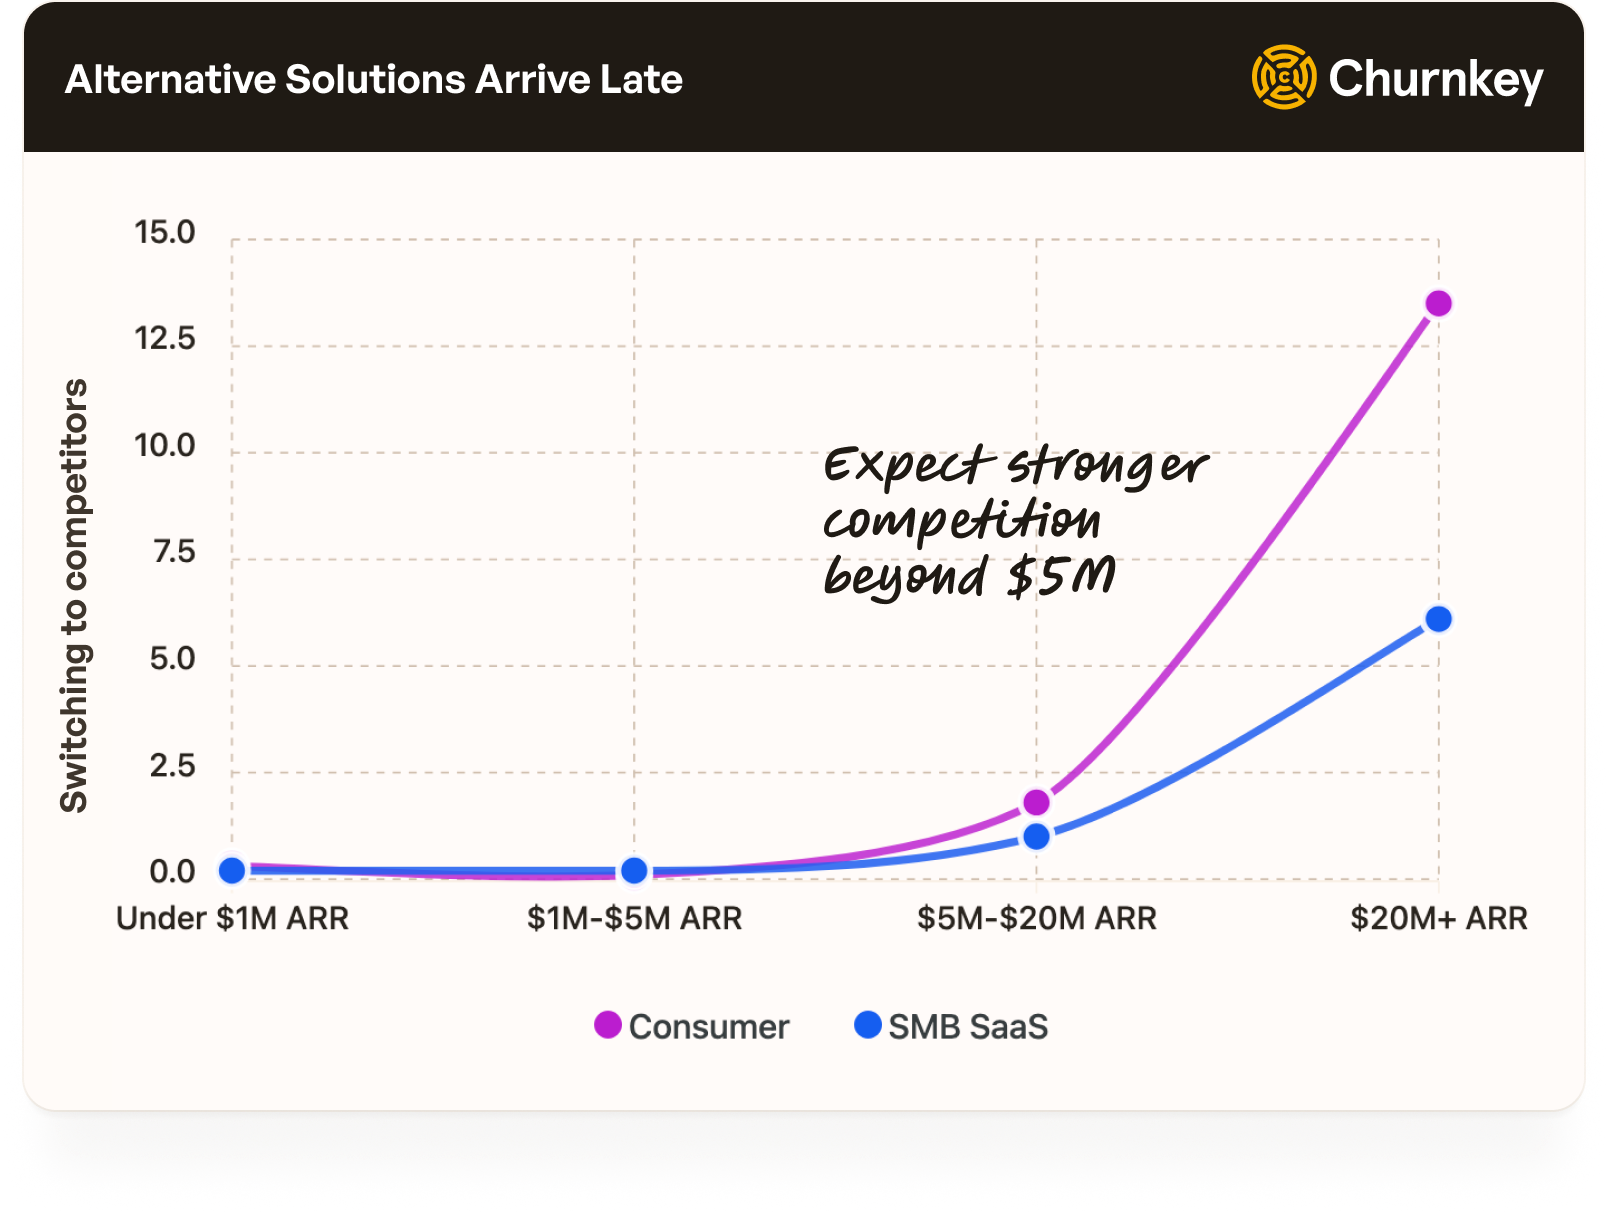
What's happening:
- Under $5M: You're a curiosity. Competitors don't care. VCs haven't funded copycats yet.
- $5M-$20M: The category is validated. Funding floods in. 10 competitors launch.
- $20M+: You're now in a knife fight. Every customer evaluates 3-5 alternatives before choosing.
SMB SaaS follows the same pattern. It goes from 0.2% to 6.1% (30x increase) by 20M+ ARR.
But notice: SMB competitive intensity at $20M+ (6.1%) is half of consumer competitive intensity (13.5%). This is because consumer products are easier to replicate. There is no sales team required, and have inherent viral distribution. SMB products involve implementation, integrations, and customer success, all of which are relatively harder to clone.
The Key Insight:
The moat you build at $5M determines whether you survive the competitive flood at $20M. Consumer companies that don't add integration depth, workflow lock-in, or network effects by $10M ARR may get commoditized by $25M ARR.
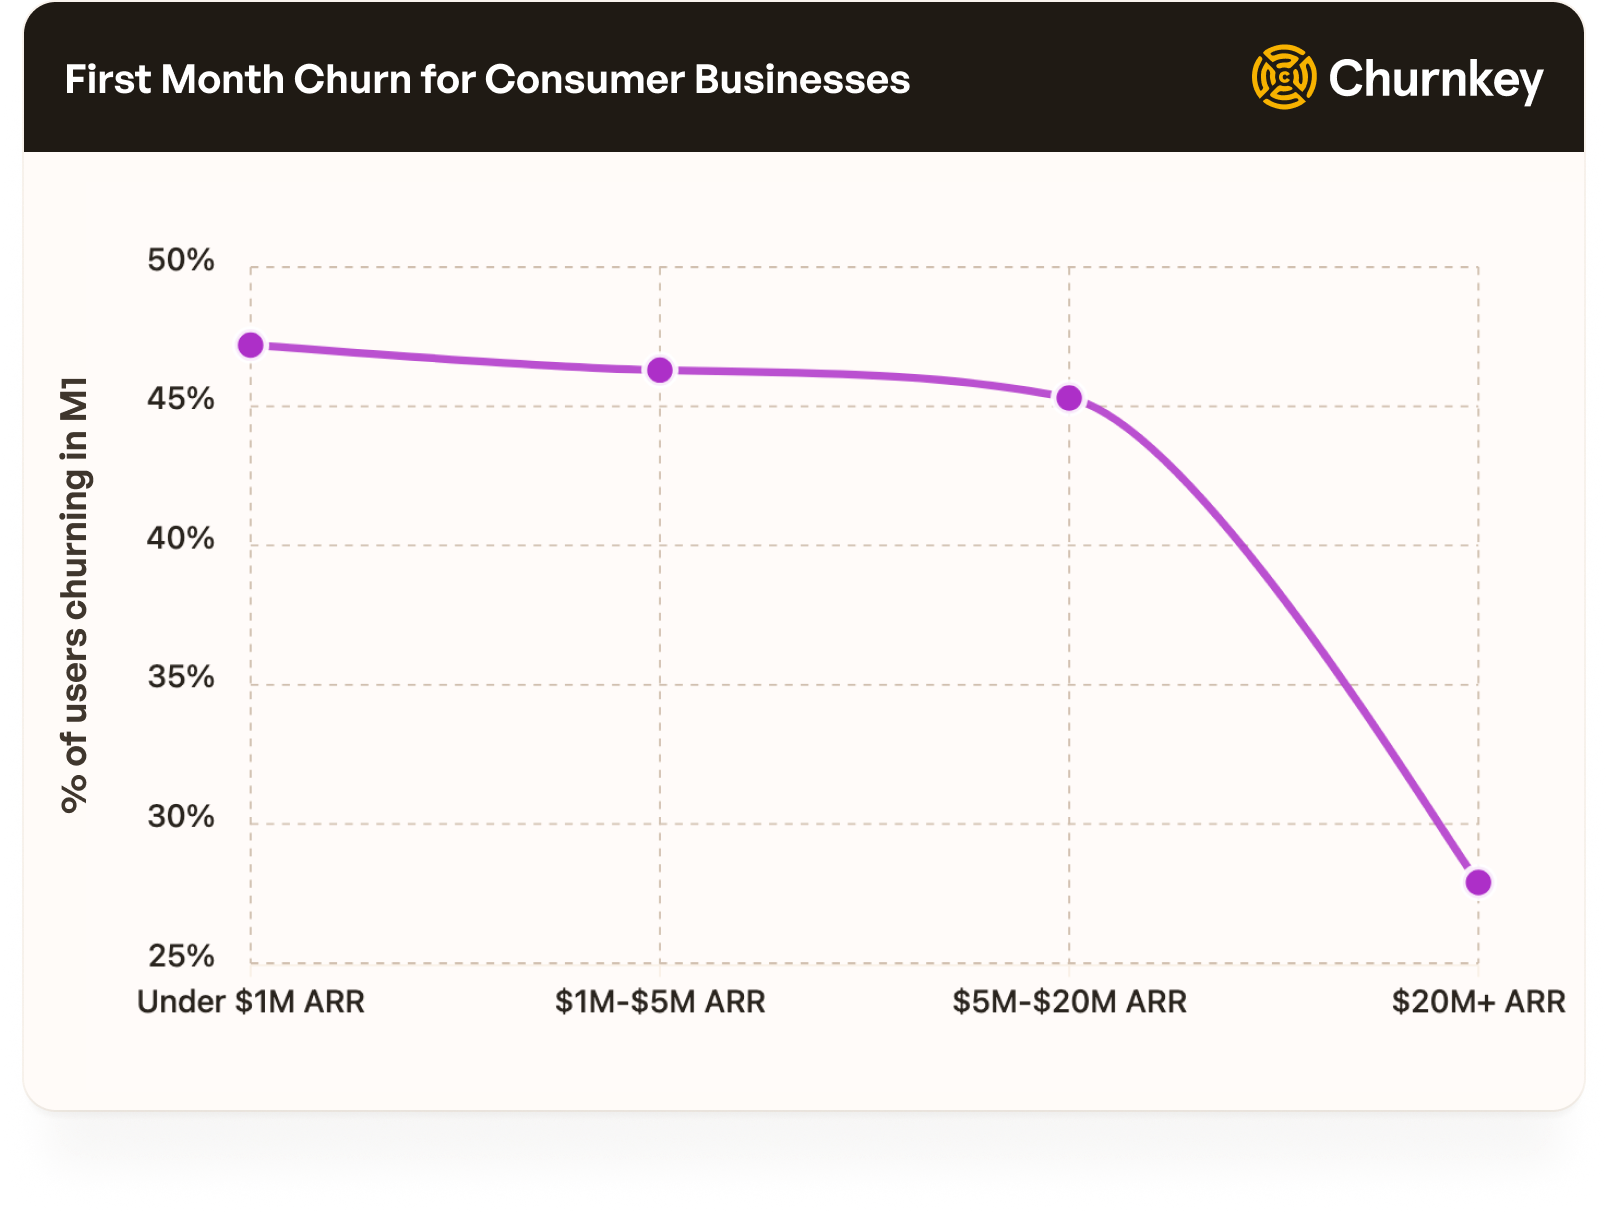
VII. Month 1 Churn Is Critical
As companies mature, they get better at improving Month 1 churn rates.
For consumer companies, they start losing 47% customers when under $1M in ARR. But at $20M+ in ARR, their M1 churn rate drops to 28%.
We see the same pattern in SMB SaaS companies. Higher first month churn that is somewhat curtailed in the last stage.
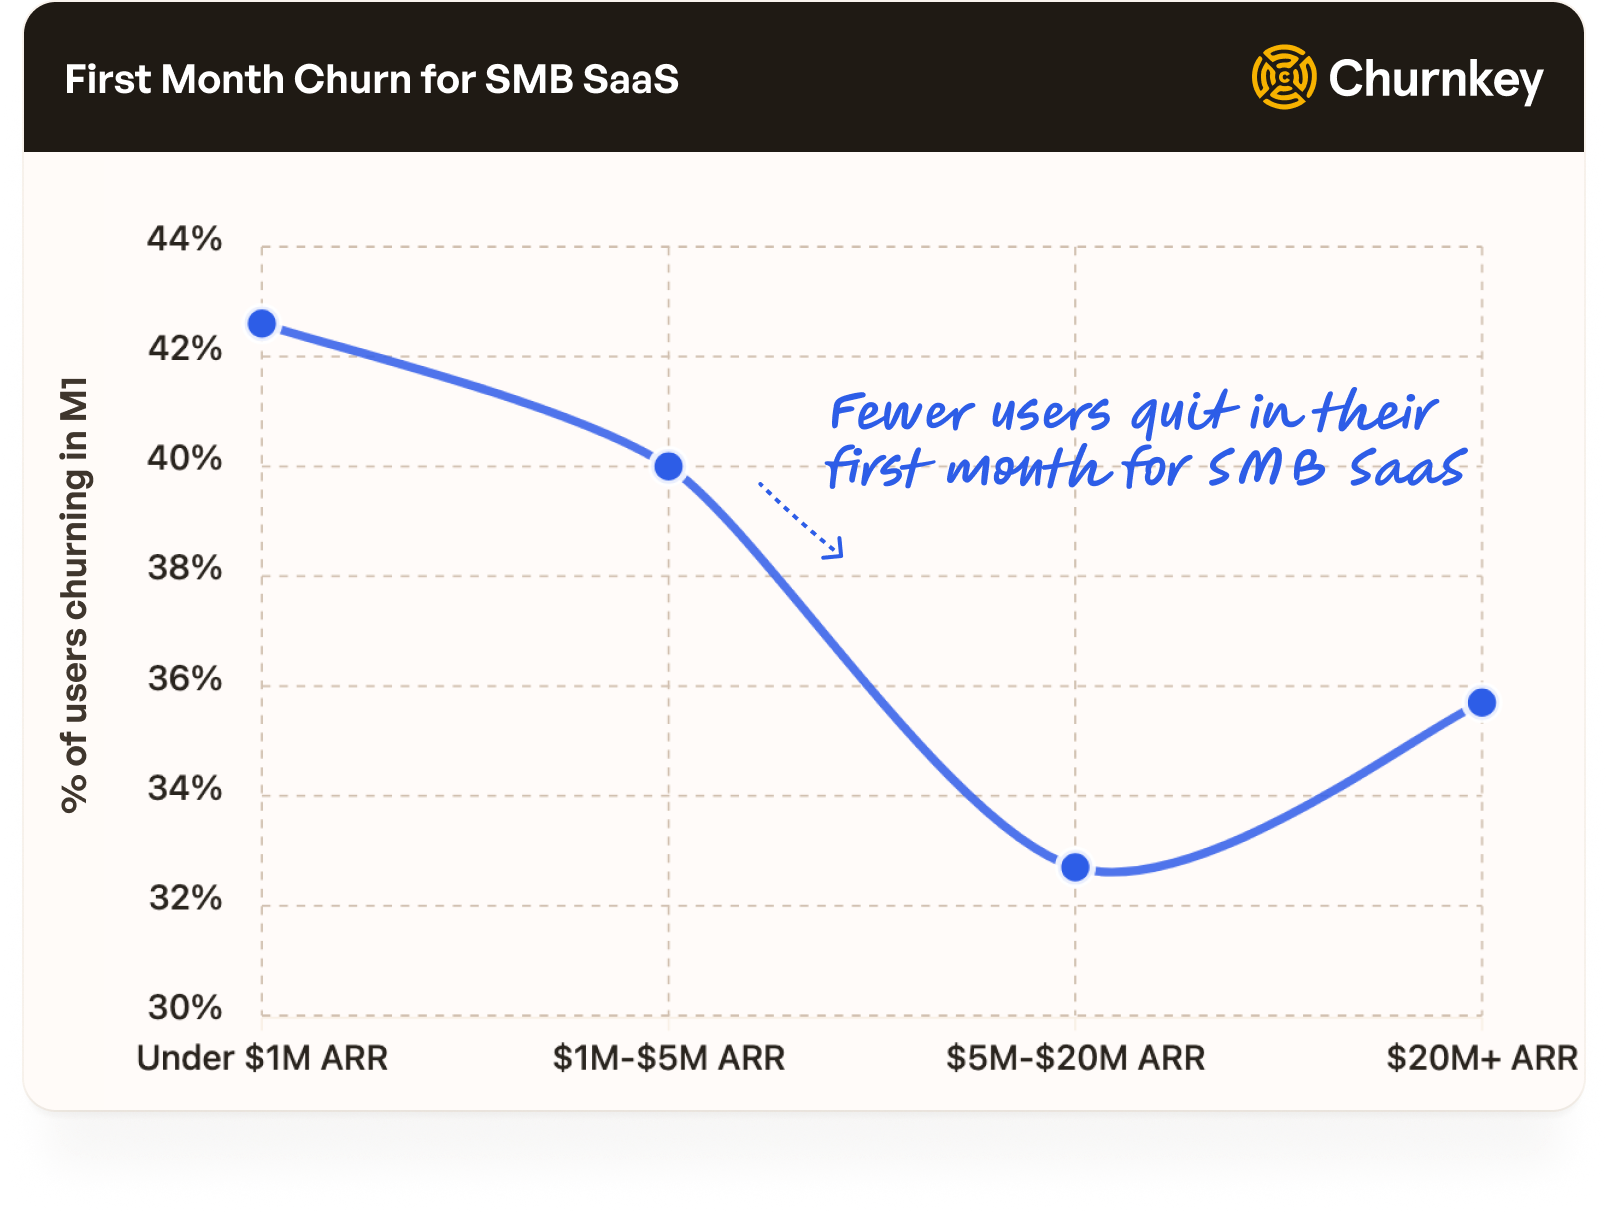
The Key Insight:
Look at your M1 churn. As you scale, improve this metric.
Churnkey has a free churn metrics product that helps you map your retention cohorts and cake charts. Unlike other free tools on the market, you can segment it by different variables to see how one cohort compares to another.
Thank you for reading another edition from Churnkey Labs, where we dive into billions of dollars of subscription revenue to uncover interesting findings on retention.
To stay in the loop, follow us on LinkedIn and write to us about the topics you want us to cover.