AI tools
Marketing tools
Creative tools
Developer tools
Productivity tools
Operations tools
This report combines data from Stripe with Churnkey's retention suite to bring you the most comprehensive churn insights on involuntary churn.
Churnkey partnered with Stripe to bring you one of the most detailed breakdowns of voluntary and involuntary churn available today.
This is part 2 of the series. If you've read part 1, skip to the "How to Reduce" section.
It reveals not just what involuntary churn looks like, but what works to prevent it.
Taylor O'Brien, former Group Product Manager - Involuntary Churn, at HBO Max said to us:
"One of the biggest challenges was where we stood relative to other companies. Leadership kept pressing us for benchmarks! Benchmarks for involuntary churn levers don’t really exist.
If you put benchmarks out, that would be a good inbound marketing tactic. Retries rates, recovery rates, net churn per industry — would be super helpful"
The data below covers subscription transaction data across businesses on Stripe. On average, subscription-based businesses lose 39% of all customers they acquire. On the furthest end of the spectrum, we have travel companies who lose 43% of all customers they acquire. SaaS is at 39% annual churn.
| Industry | Monthly churn* | Annual churn |
|---|---|---|
| Travel and lodging | 4.70% | 43% |
| Business services | 4.20% | 40% |
| Education | 4.20% | 40% |
| Merchandise | 4.10% | 39% |
| Digital goods | 4.00% | 38% |
| SaaS | 4.00% | 38% |
| Insurance | 3.90% | 37% |
| Personal services | 3.70% | 36% |
| Leisure | 3.70% | 36% |
*Source: Annual churn rates come from Stripe; monthly churn rates calculated by Churnkey
When we break down these churn rates by voluntary vs involuntary rates, we see a different picture.
We’ve added two columns — total involuntary churn rate, and % of involuntary churn to help analyze the data.
| Industry | Total annual churn rate | Annual involuntary churn rate | Involuntary churn as a % of total churn |
|---|---|---|---|
| Digital goods | 38% | 11% | 29% |
| Business services | 40% | 10% | 26% |
| Personal services | 36% | 9% | 25% |
| Education | 40% | 10% | 24% |
| Merchandise | 39% | 9% | 23% |
| SaaS | 38% | 8% | 22% |
| Travel and lodging | 43% | 8% | 18% |
| Leisure | 36% | 6% | 17% |
| Insurance | 37% | 3% | 9% |
Source: Stripe
🟢 Insurance companies have the best involuntary churn rates, with only 9% of their total churn resulting from payment failures.
🔴 Digital goods experience the highest percentage of involuntary churn. 29% of all churn is due to failed payments or other involuntary reasons.
🟡 For SaaS companies, involuntary churn rate averages at 22% of all churn. That means, if you’re doing $10M a year in revenue with 38% annual churn, you’re losing $836,000 in involuntary churn.
Try it here:
B2C vs B2B churn rates look nearly identical.
B2C companies lose 39% of all customers each year, whereas B2B companies lose 38%.
| Business model | Monthly churn rate | Annual churn rate |
|---|---|---|
| B2C | 4% | 39% |
| B2B | 3.82% | 38% |
However, B2C companies seem to lose more due to involuntary churn than their B2B counterparts. 24% of all churn for B2C companies is due to payment failures.
| Business model | Annual churn rate | Annual involuntary churn rate | Involuntary churn as a % of overall churn |
|---|---|---|---|
| B2C | 39% | 9% | 24% |
| B2B | 38% | 6% | 16% |
Source: Stripe
Data shows that price and total churn are inversely related. As price decreases, total churn increases.
However, involuntary churn doesn’t stay linear. The lower the price, the higher the proportion of involuntary churn.
| Average order value | Annual churn rate | Involuntary churn rate | Involuntary churn as a % of total churn |
|---|---|---|---|
| Less than $10 | 40% | 14% | 35% |
| Between $10 and $30 | 37% | 9% | 23% |
| Between $30 and $100 | 34% | 9% | 26% |
| Between $100 and $1,000 | 30% | 6% | 19% |
| Between $1,000 and $10,000 | 24% | 4% | 15% |
| Greater than $10,000 | 15% | 4% | 24% |
Source: Stripe
Focusing on SaaS businesses shows an interesting picture. AI companies have the highest overall churn.
Source: Churnkey
When broken down by voluntary vs involuntary, we see that AI companies lose less to involuntary churn than others. 15% of all churn is involuntary.
Source: Churnkey
The Takeaway:
A good churn strategy focuses on both involuntary and voluntary churn. At Churnkey, we've found three effective solutions to reduce involuntary churn.
By using these three methods, we recovered 70% of all involuntary churn detected.
Cards fail for many reasons. Some are hard declines, such as “Stolen Card,” which cannot be retried.
But often, they’re soft declines like “Do Not Honor” or “Insufficient Funds” which can usually be recovered without customer intervention.
Across 5M failed subscriptions, Insufficient Funds was the leading cause of payment failures, making up 40.5% of all failures.
Do Not Honor (7.5%) is a catch-all decline code when banks don’t tell you the reason why the payment failed. However, it’s a soft decline and can be retried.
| Decline code | Percentage |
|---|---|
| Insufficient funds | 40.56% |
| Transaction not allowed | 8.83% |
| Highest risk level | 7.99% |
| Do not honor | 7.56% |
| Previously declined do not retry | 6.44% |
| Generic decline | 5.78% |
| Incorrect number | 4.69% |
| Try again later | 4.13% |
| Partner insufficient funds | 3.68% |
| Invalid account | 2.71% |
| Expired card | 1.14% |
| Card velocity exceeded | 1.05% |
| Pickup card | 0.94% |
| Lost card | 0.78% |
| Stolen card | 0.72% |
| Paypal payment declined | 0.45% |
| Link connection closed | 0.42% |
| Cashapp customer request expired | 0.41% |
| Incorrect CVC | 0.39% |
| Blocklist | 0.37% |
| Cashapp payment declined | 0.32% |
| Revocation of authorization | 0.20% |
| Processing error | 0.19% |
| Requested block on incorrect zip | 0.14% |
| Invalid amount | 0.11% |
Source: Churnkey
Retries are very performant, and often recover the most of all three methods.
Setting this up requires no engineering lift.
| Payment Recovery | Average Days to Recovery | |
|---|---|---|
| Only Stripe Retries | 51% | 5.5 |
| Churnkey Precision Retries + Stripe Retries | 55% | 4.8 |
| Improvement | +4% more recovered | 0.7 days faster |
Source: Churnkey
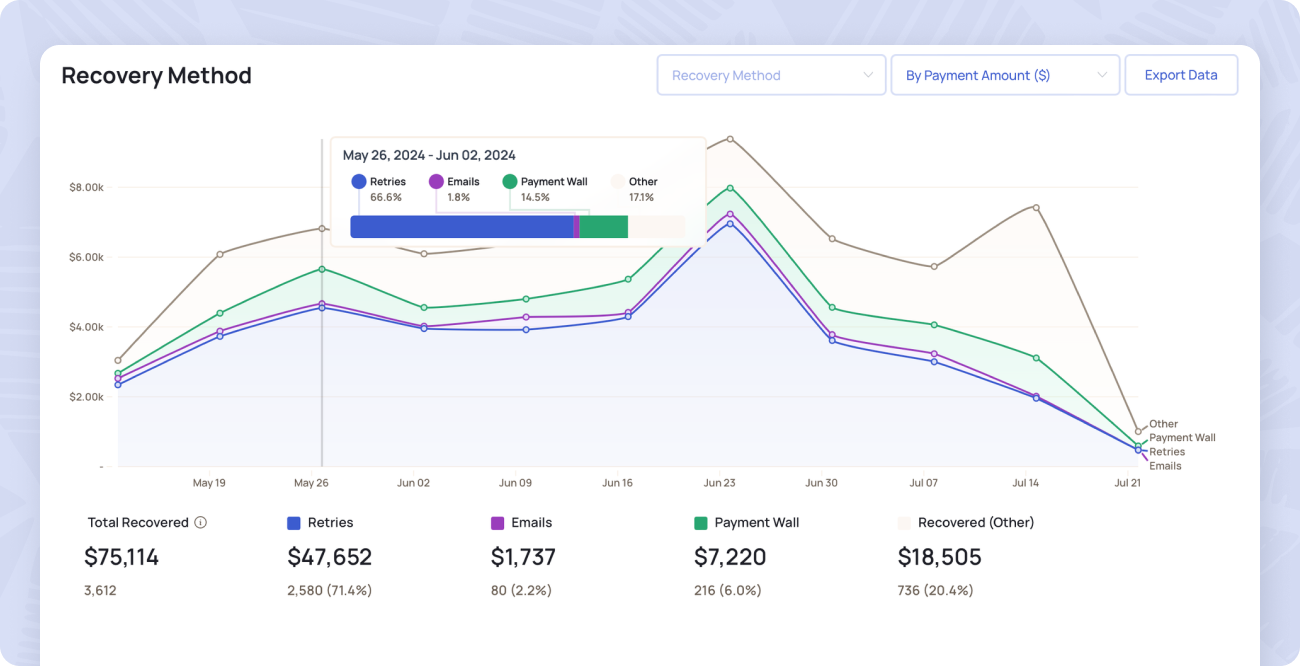
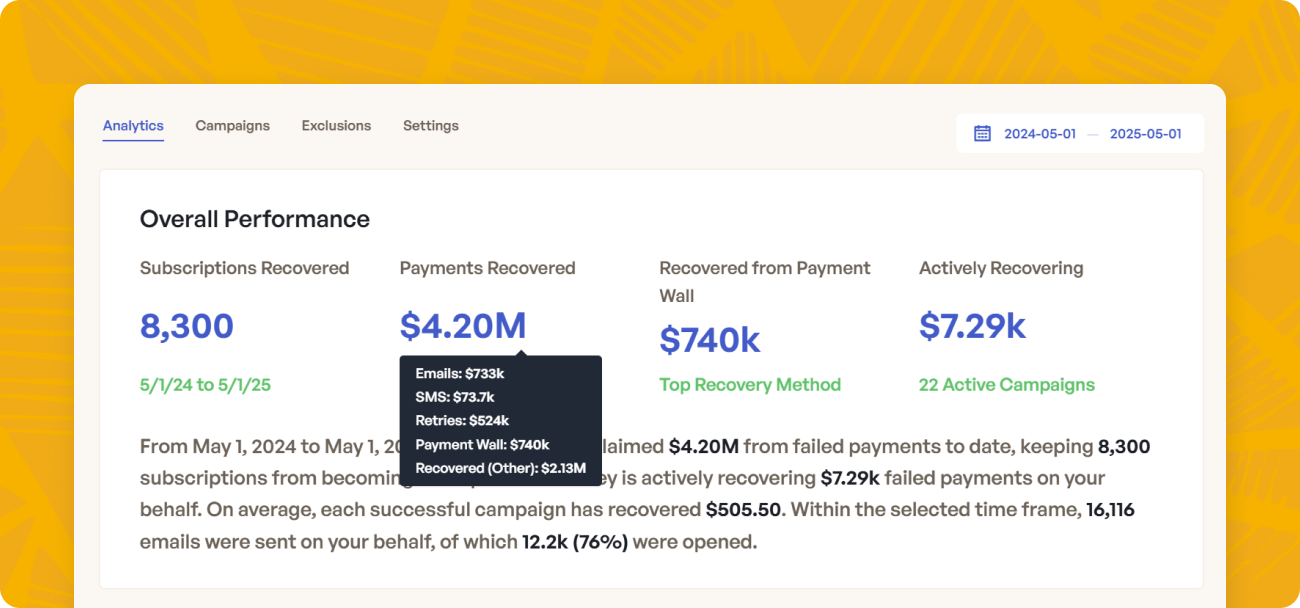
Tracking performance:
You will be able to track revenue recovered by Churnkey and Stripe Smart Retries in your Churnkey dashboard. Churnkey's Precision retries are called 'Retries' and Stripe falls under 'Other' in the dashboard. For this customer, we see Precision Retries made up 66% of all recoveries. This dashboard gives you transparency into what’s working.
Typical email open rates are low. A failed payment wall helps alert customers while they’re in-product, incase the email never got to them.
It restricts access to the product when a payment fails.
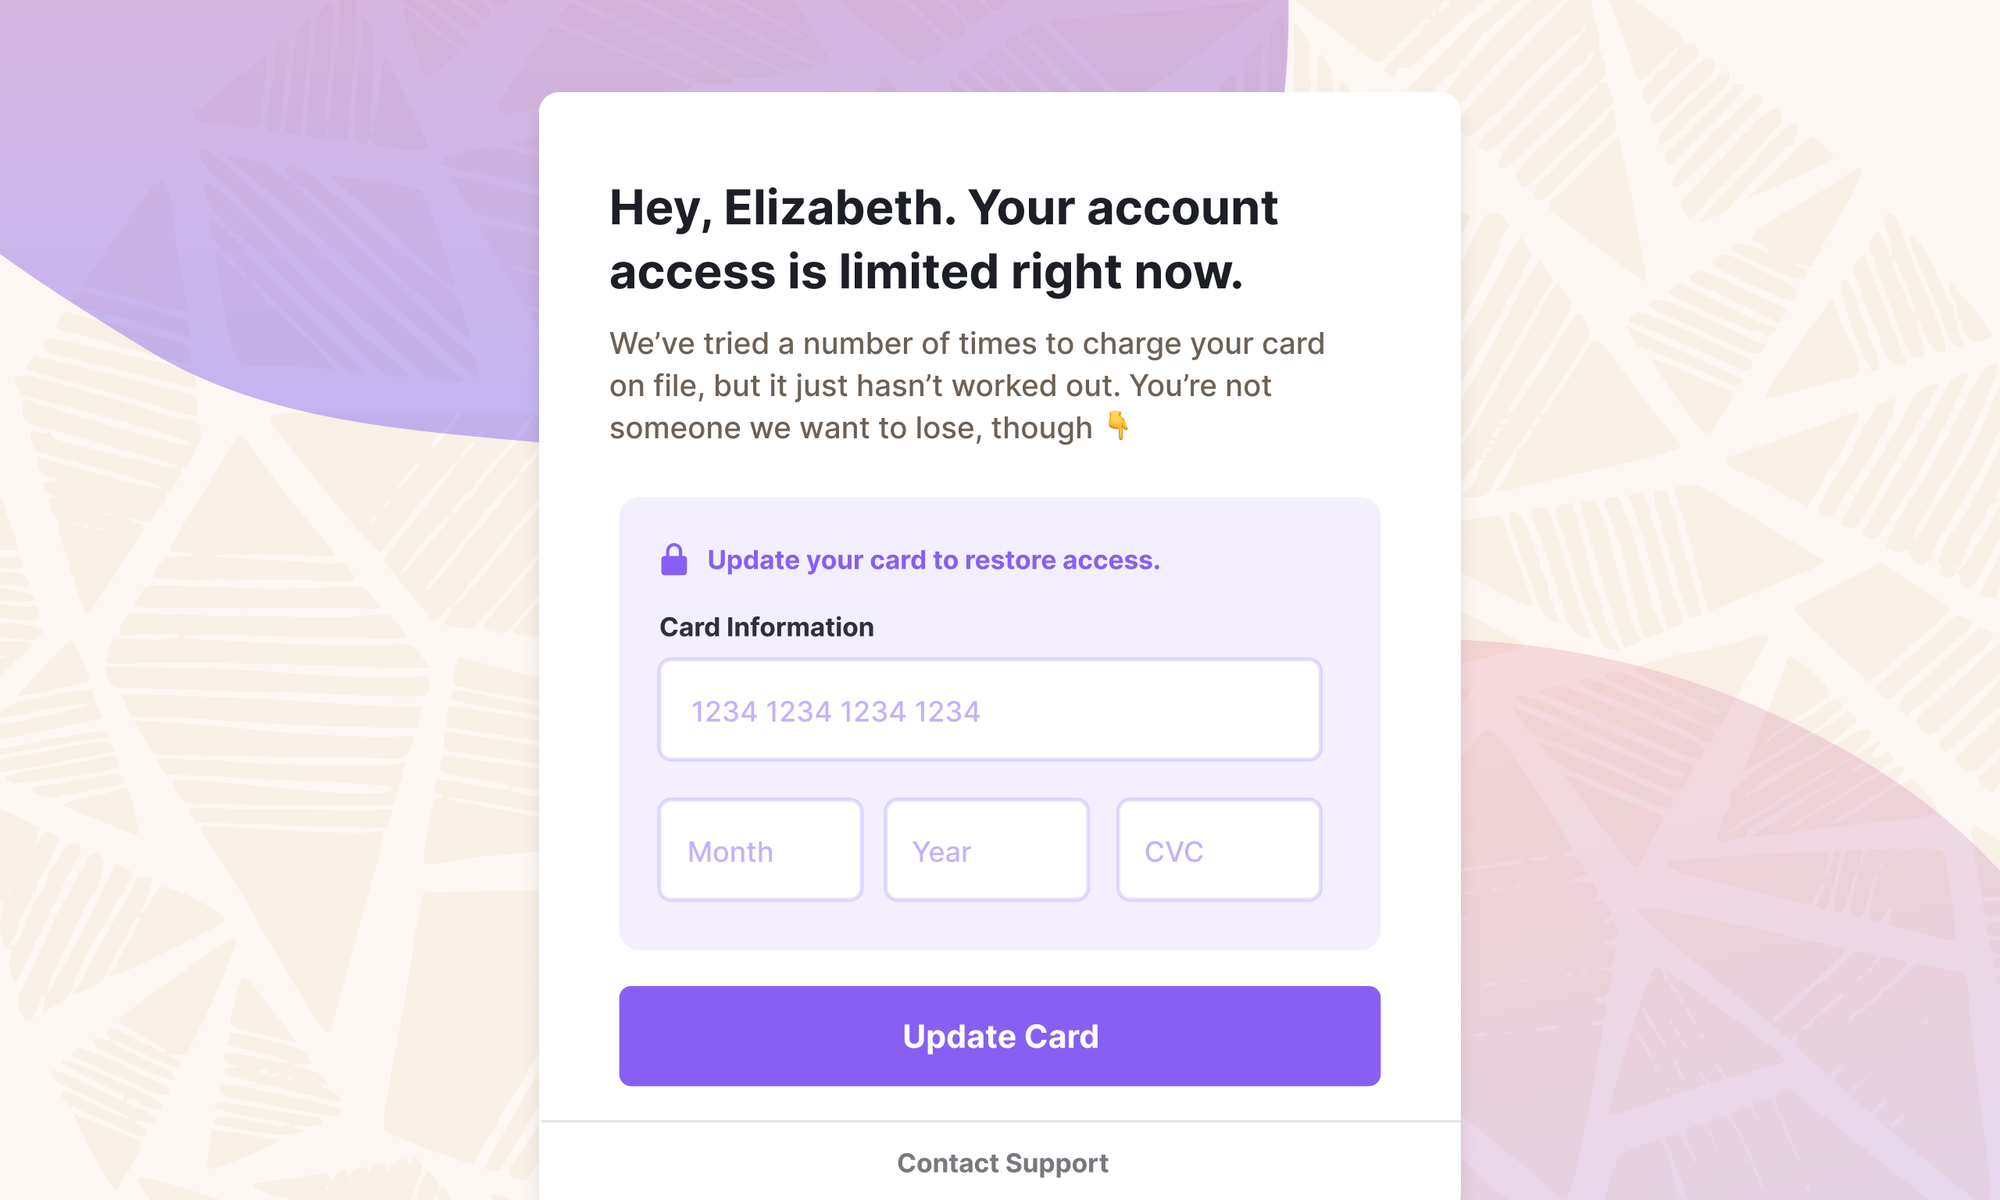
You can offer a soft wall or a hard wall. Some companies offer grace period before revoking access completely.
In Churnkey, you can set how long and short you want your grace period to be.
This is available in Churnkey for exclusively for Stripe customers. You can share implementation instructions with your team → Failed Payment Wall Docs
When payments fail, you send emails to customers about the failed payment. And most businesses have some sort of dunning campaign already set up.
Each dunning email with Churnkey provides an additional +1-2% recovery in payments.
| Days | Recovery % | Open % | Click % |
|---|---|---|---|
| Dunning email 1 | 2.8% | 55.8% | 7.1% |
| Dunning email 2 | 1.9% | 48% | 3.2% |
| Dunning email 3 | 1.7% | 39.7% | 4.2% |
| Dunning email 4 | 1.5% | 29.8% | 3.2% |
| Dunning email 5 | 1.5% | 20.6% | 2.9% |
Source: Churnkey
We recommend that you compare the recovery rate. Since these are transactional emails, open rates should hover around 40%.
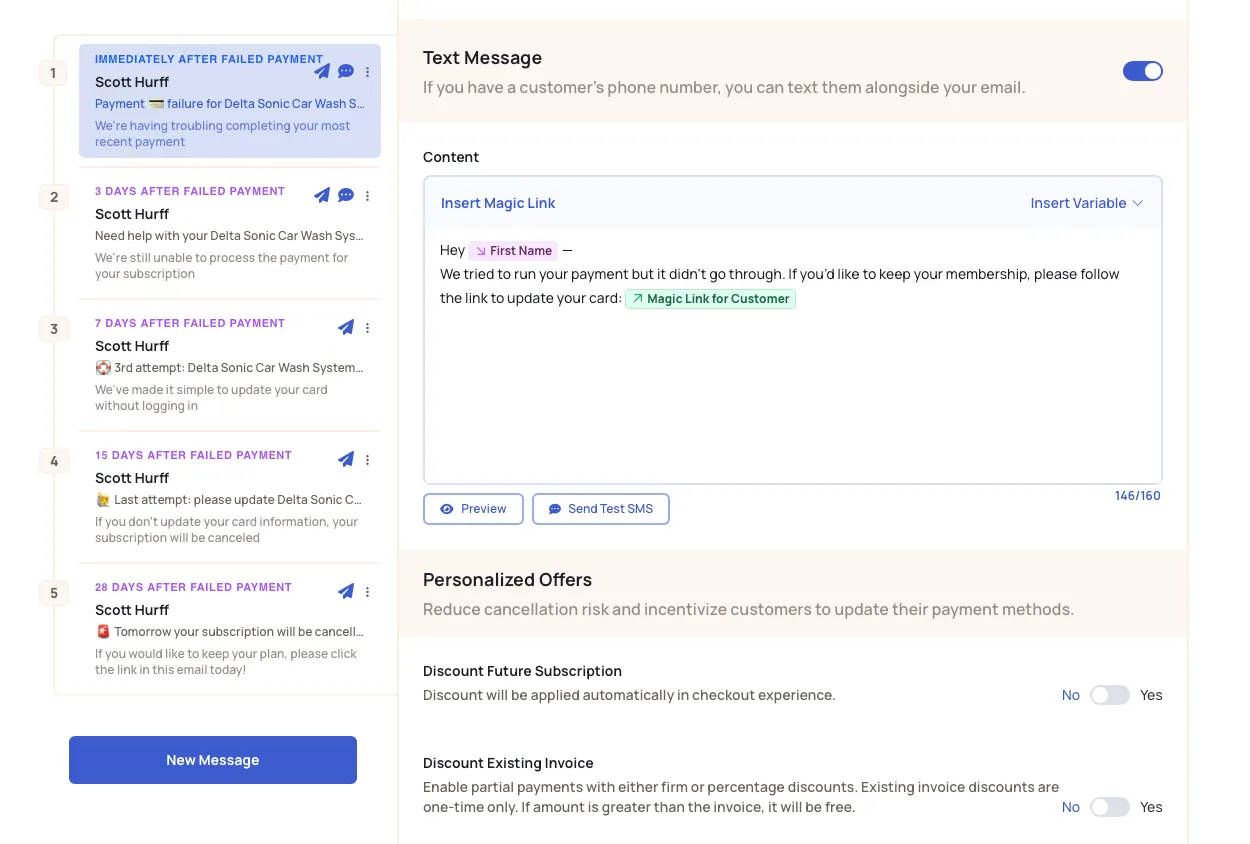
To have best-in-class payment recovery from dunning emails, we do things a bit differently.
1. Make the process as frictionless as possible. Customers are never asked to login.
2. Allow partial payments or discounts on a future payment.
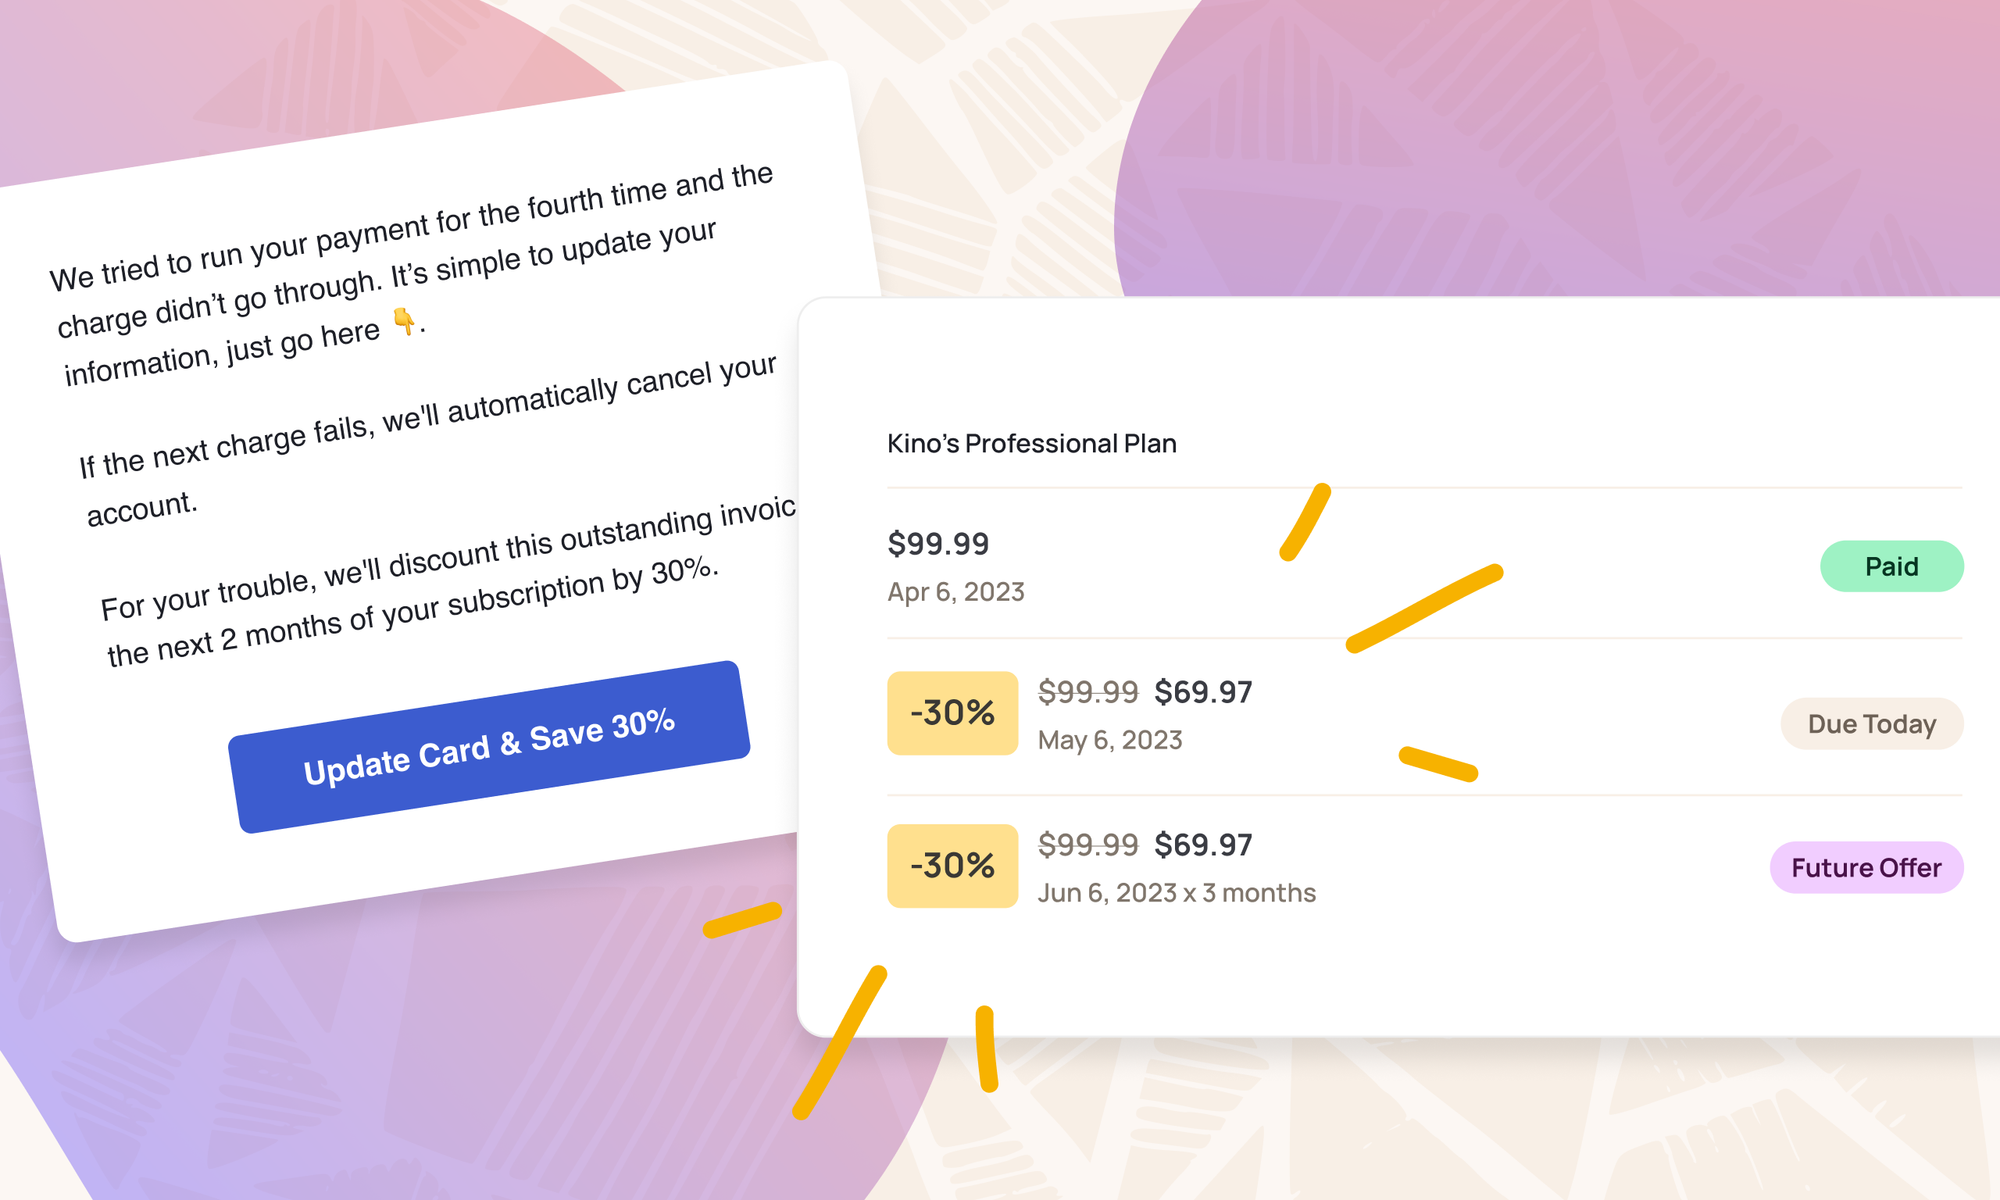
3. Test different offers
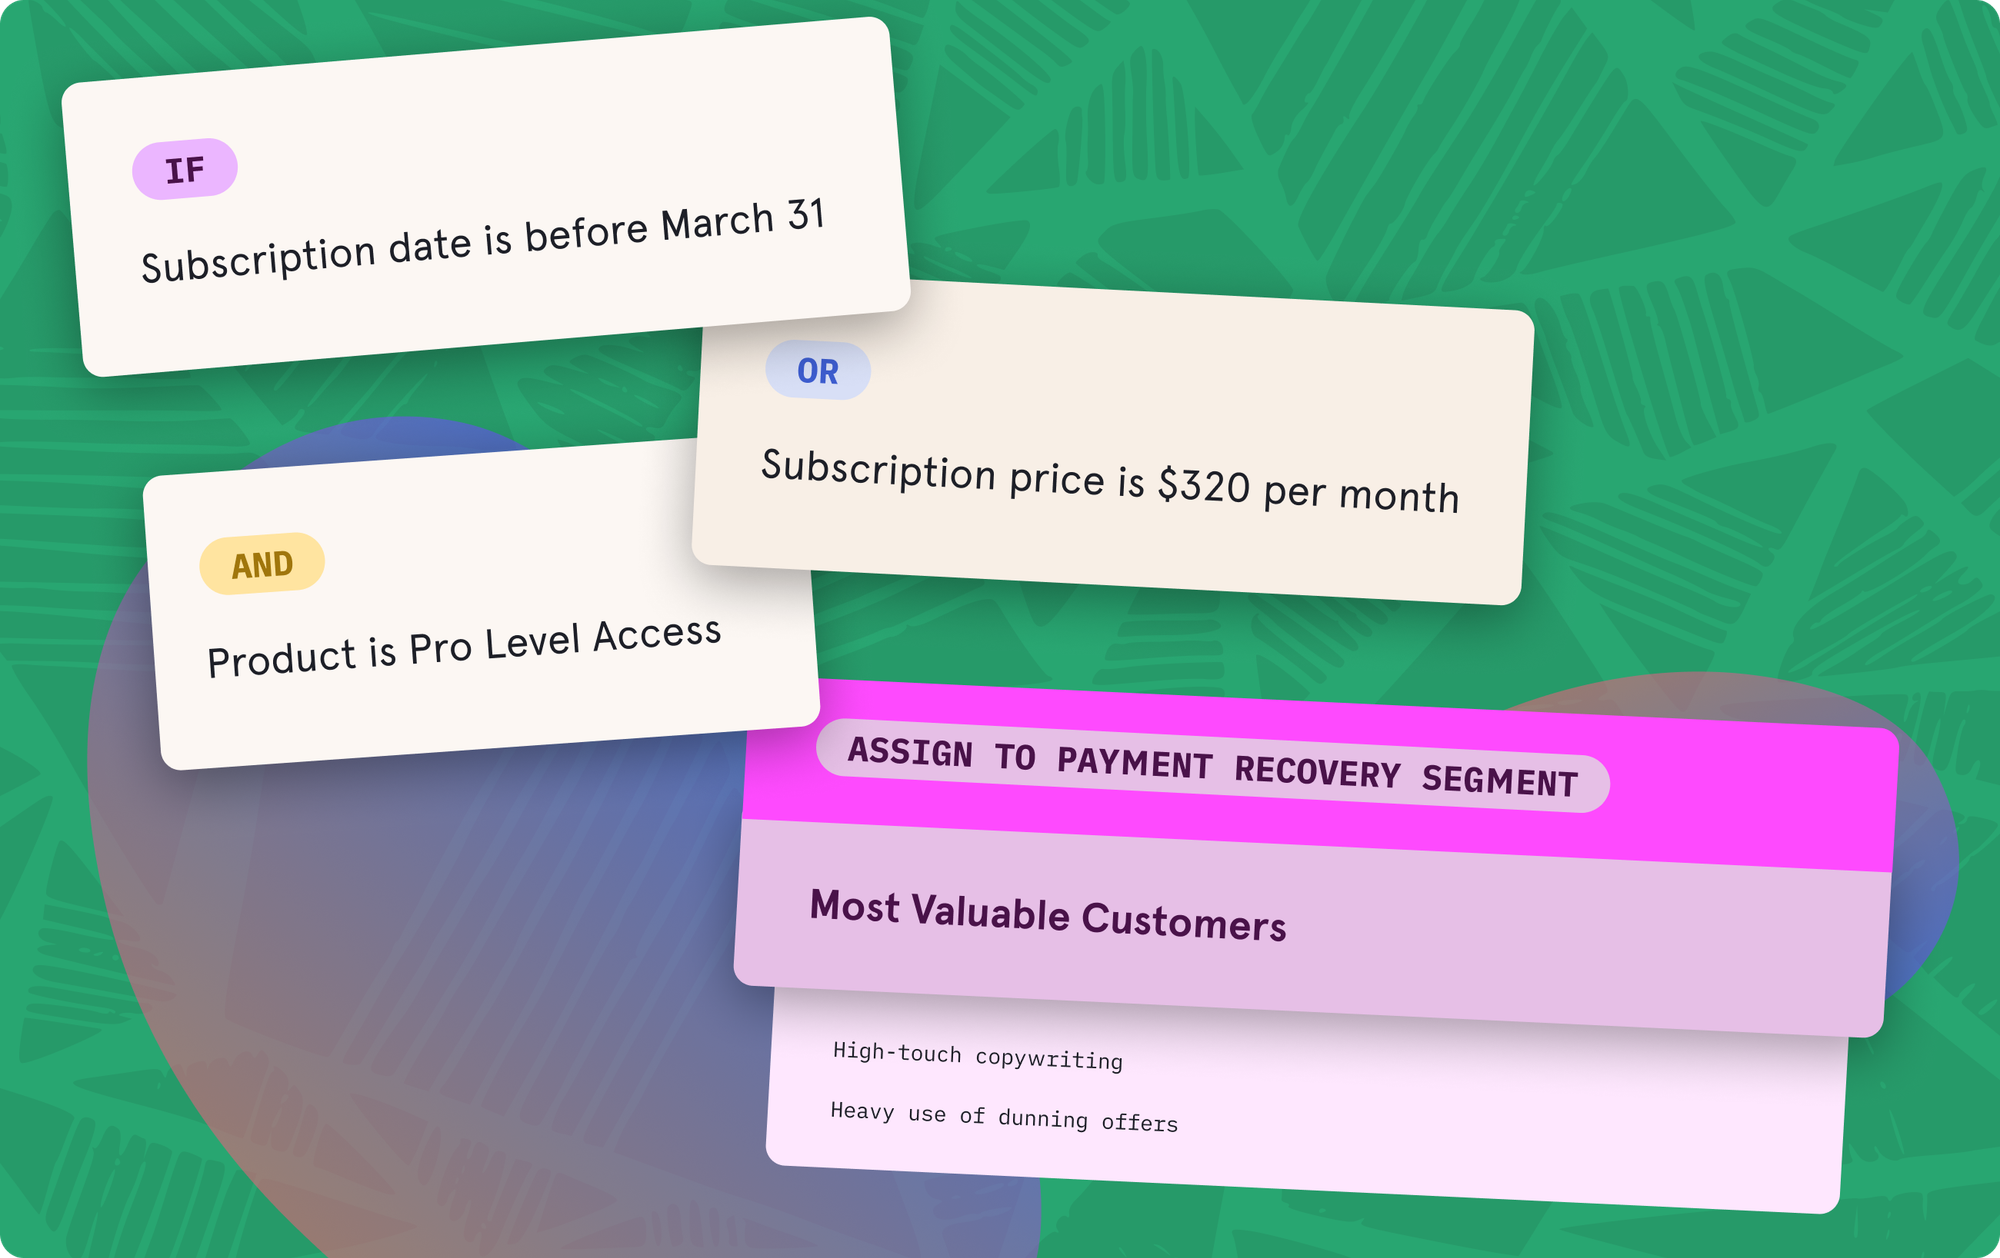
Churnkey can take into account how long they’ve stayed with you, what plan they’re on, how much have they used it. At Churnkey, you have best-in-class A/B testing and segmentation.
4. Measure dollar amounts of recovered revenue, and not just vanity metrics like open rate. Even when you run A/B tests for segments.
This is partly why traditional email marketing platforms aren't able to recover failed payments. They're simply not specialized enough.
You have two options.
Start with Stripe’s dunning email product.
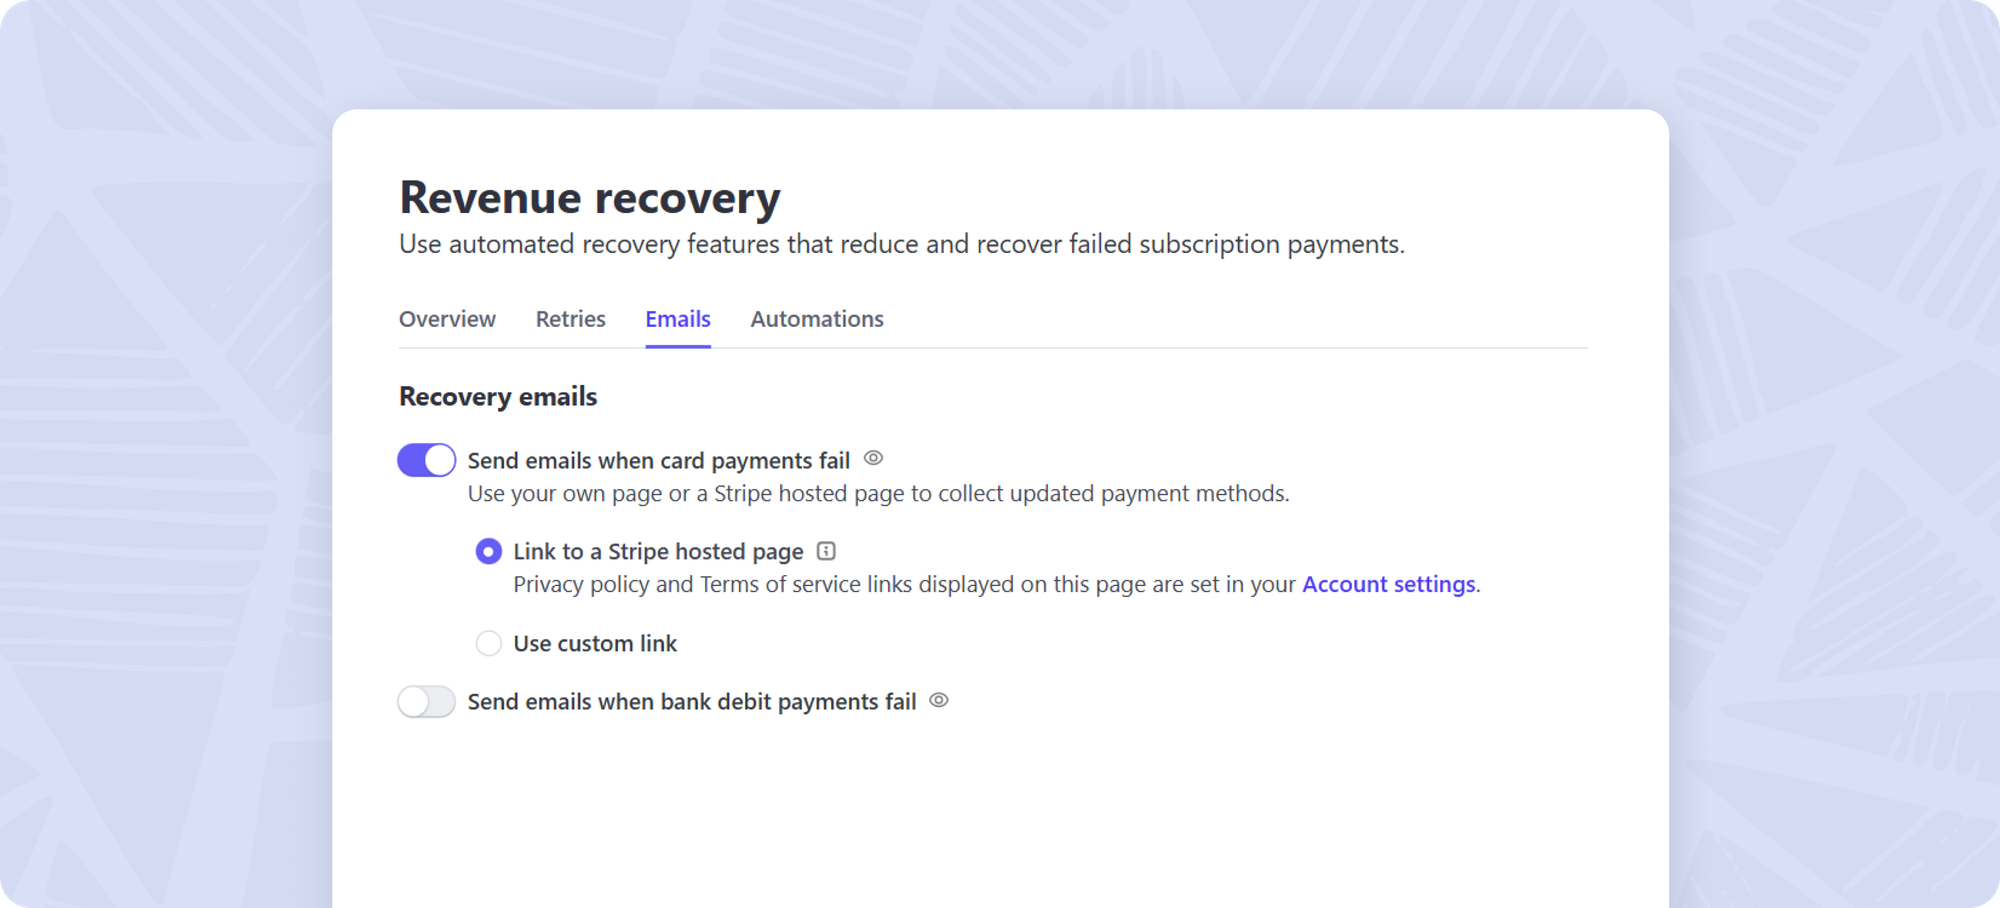
Or, graduate to Churnkey for a more sophisticated dunning system. Unlike email marketing tools, an integration with Stripe is a near one click process when you install our app. No developers are harmed in the process.
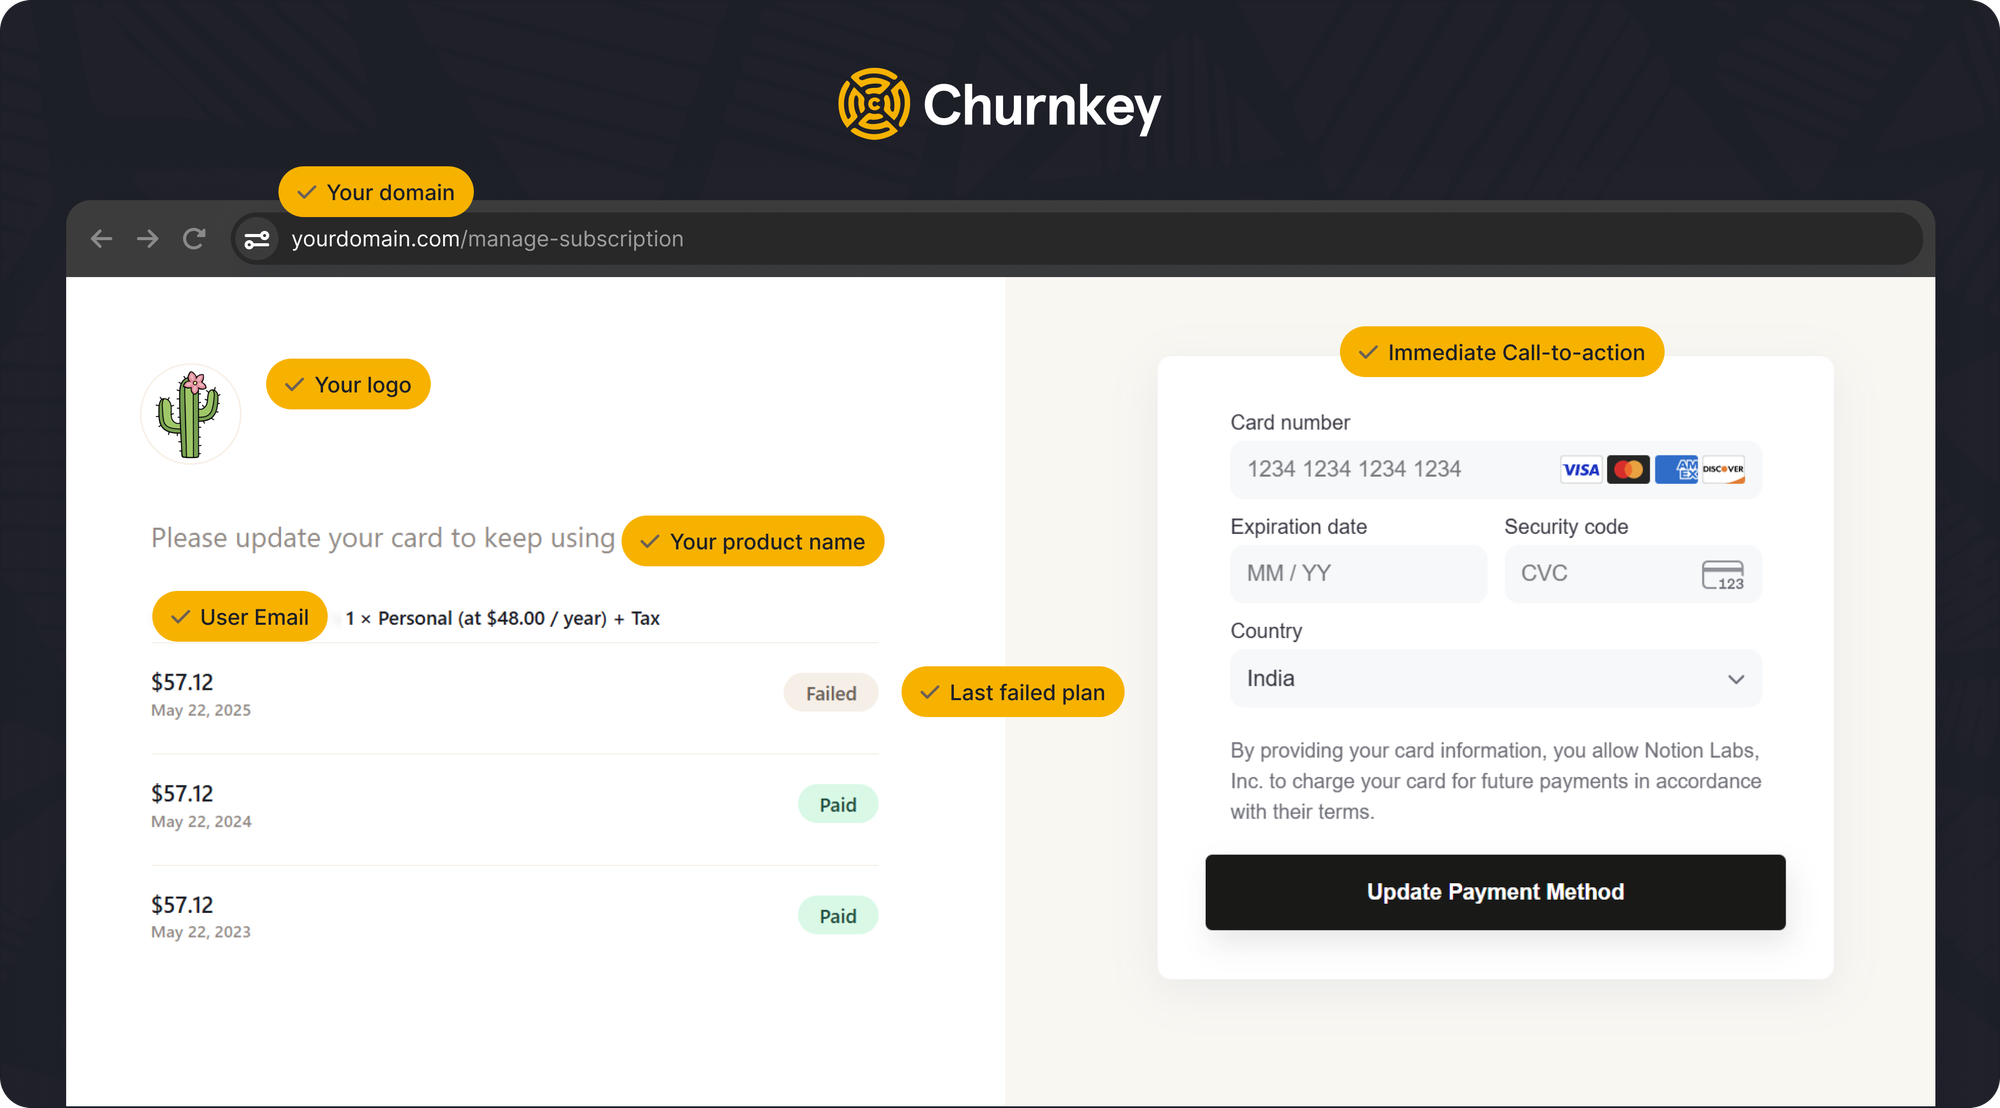
People tap the CTA and are taken to a page to enter the card. This is on-brand, frictionless, and mobile-responsive.
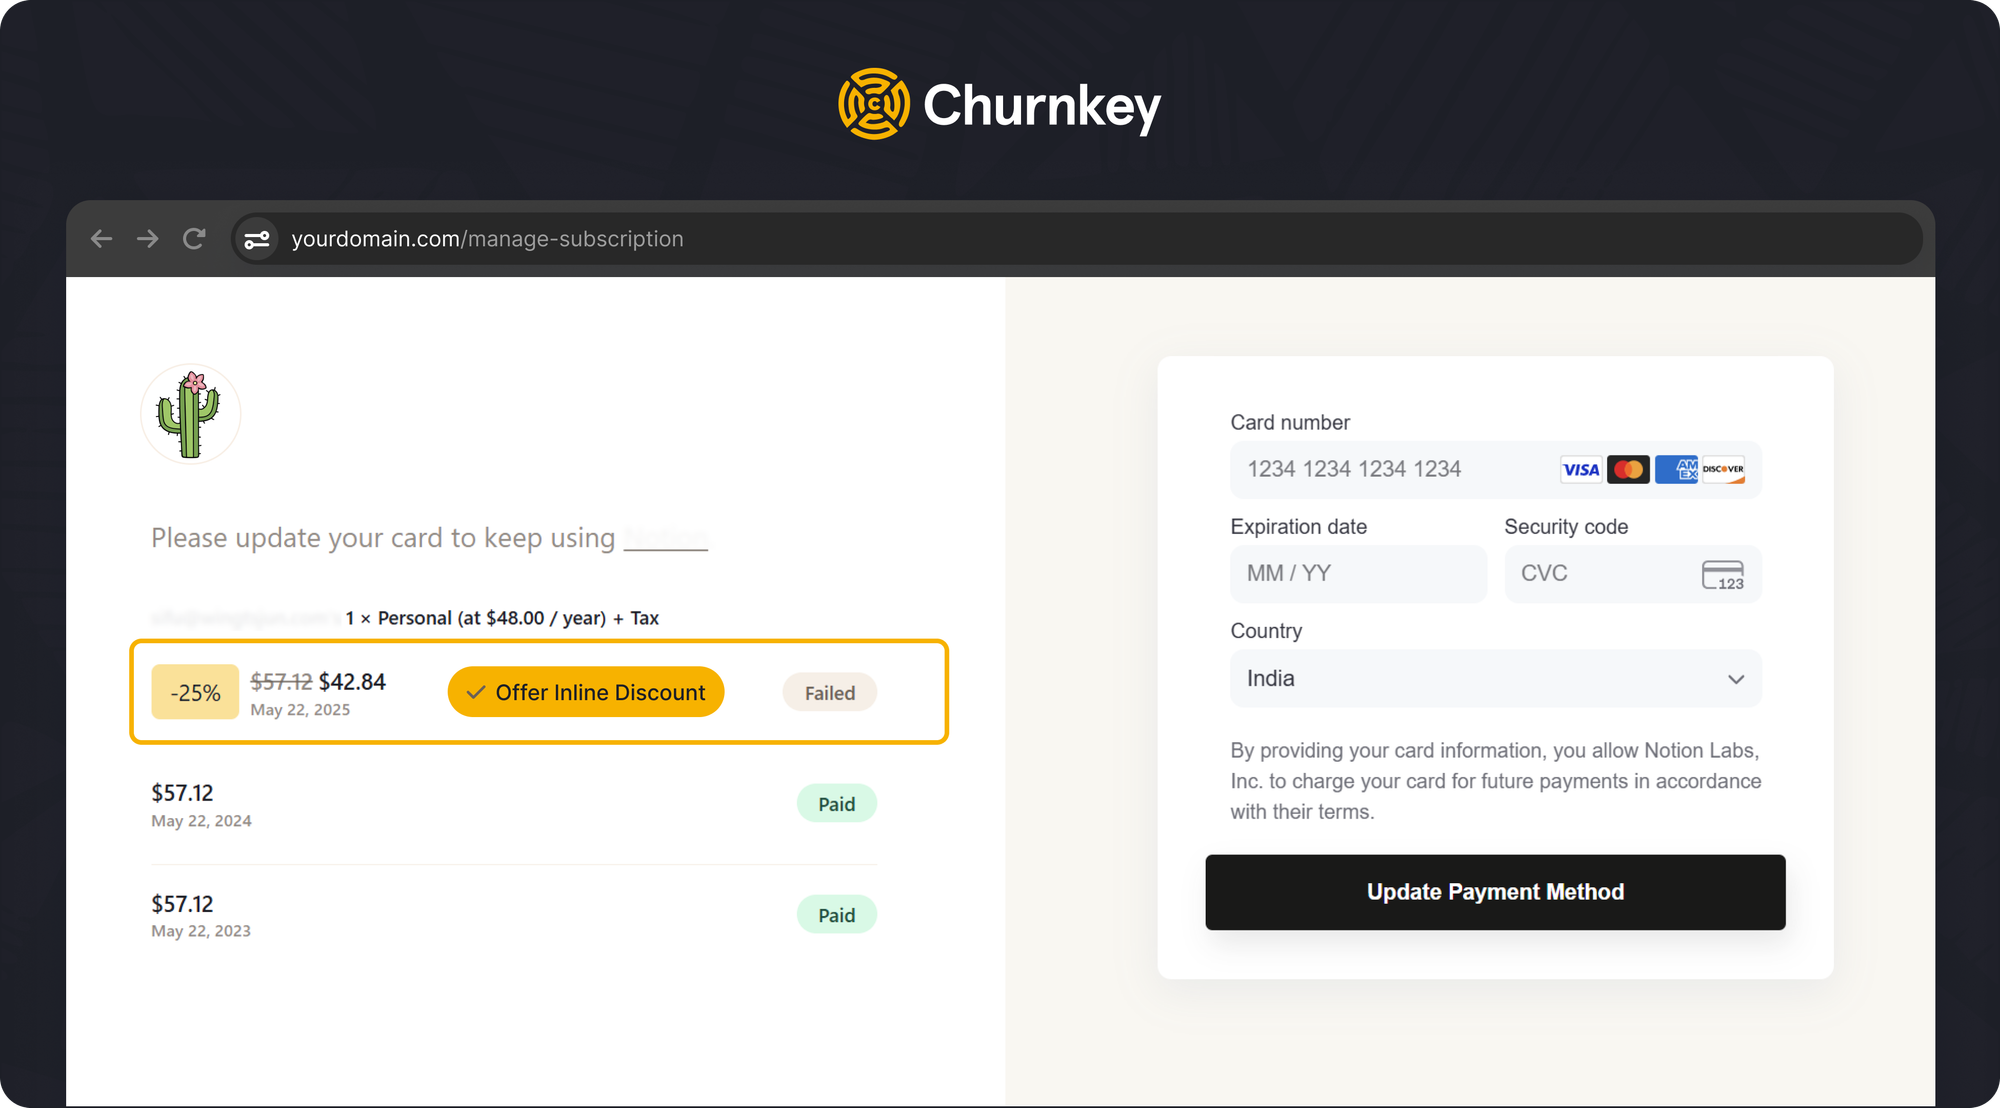
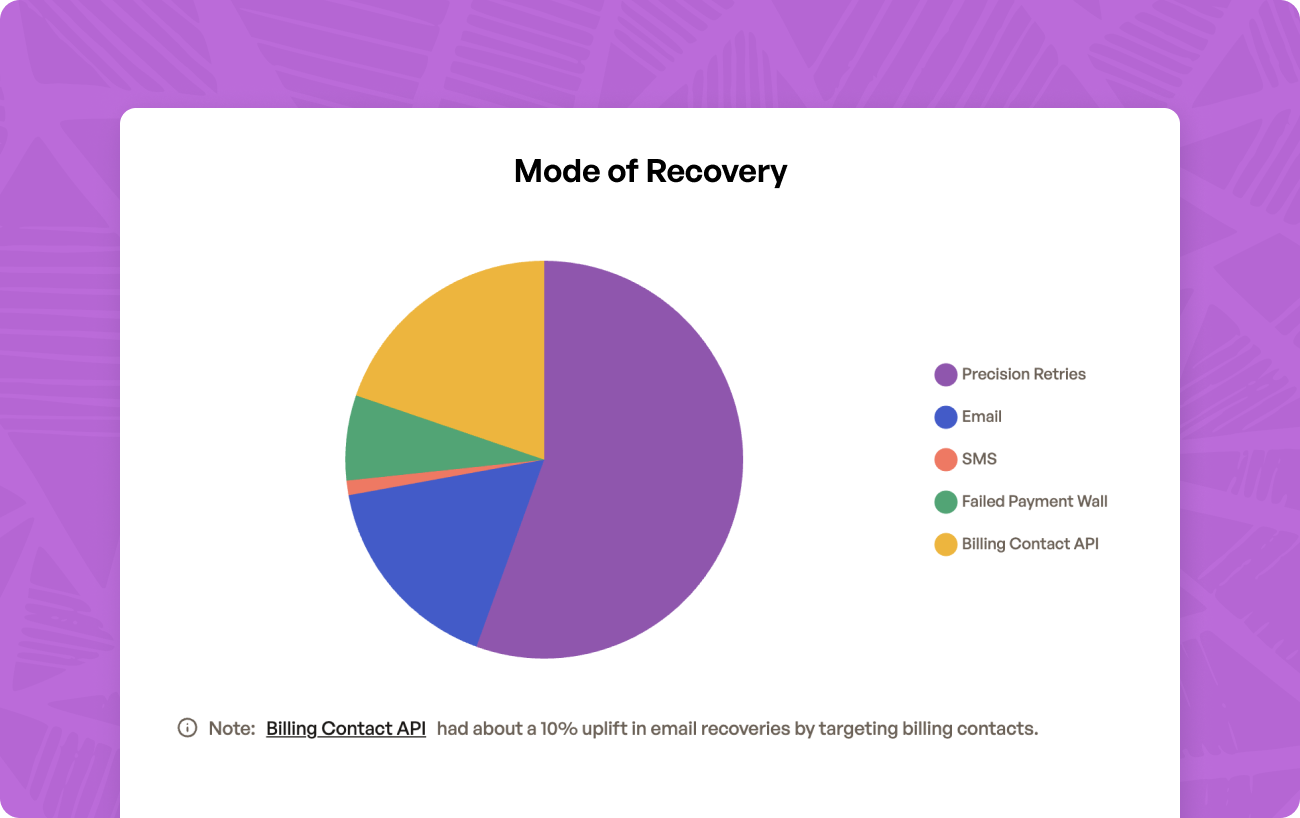
You can track recovered revenue in your Churnkey dashboard. We will show how much you have recovered from each method (email vs sms vs failed payment wall).
Churnkey also offers a way to segment your billing admins from users. So, each type of user gets an email relevant to them. This method offers a 10% lift on average. [Billing API requires some engineering help].
Voluntary churn typically makes up the majority of churned revenue. For SaaS, this is averages at 78% of all churned revenue.
If you enjoyed this report, read:
On average, customers that use Churnkey's retention suite save 20-40% of the revenue that they would have otherwise lost to churn.
Even a 5% monthly churn rate results in losing half of all your customers annually.
So, if retention is a priority, check out our entire suite of products at churnkey.co.
Book a demo with us or sign up for an account.
We'd love to have you with us.