How to Identify Productive Usage Patterns in Your Product

When it comes to SaaS products, your customers are constantly providing you with an incredibly useful amount of data with regards to your services, products, and overall business. If you know what you’re looking at, that customer data can offer you invaluable insights into your churn rates, product growth, and more. But first you have to know how to identify productive usage patterns in your product.
Let’s talk about how you can learn to identify these patterns in your SaaS products.
How to Identify Productive Usage Patterns in Your Product
Why do productive usage patterns matter?
When you measure and analyze product usage, you get a chance to see how customers are using your product. And when you identify common usage patterns, you’re able to figure out what issues or concerns might be causing users to cancel their subscriptions, giving you the chance to address those issues and reduce your churn.
Anytime you analyze your customer data and use it to make better, data-driven decisions, you’ll be better equipped to improve engagement, drive more conversions, and prevent churn before it happens. One of the biggest challenges for SaaS companies can be uncovering and addressing potential product issues. When you track productive usage patterns over time, it makes it easier to identify what potential problems may be increasing churn.
For instance, if you see a pattern where users are dropping off before activating after a free trial or activate but then use the product less over time, you have an indicator of where your product is falling short. Of course, in order to identify these productive usage patterns, you have to know what usage metrics to track.
Here are the six metrics you should track if you want to identify productive usage patterns in your product:
1. Time-to-value
Time-to-value is the metric that indicates how much time it takes for a user to realize the value of your product. Basically, this is the lightbulb moment when a user sees the true benefit of your product and wants to stick around and learn more. In order to reduce churn, your goal should be to decrease time-to-value as much as possible.
2. Product activation rate
This rate indicates how many users that began a free trial actually made it to the activation milestone. To calculate the product activation rate, start by simply dividing the number of users who hit the activation milestone by the total number of users who signed up for the product. Now, multiply that figure by 100 to get your overall percentage.
3. Usage frequency
This metric shows you how often your customers actually use your product. When you look at this metric, you’ll be able to see whether users are taking advantage of your product daily, weekly, monthly, etc. Basically, you can see how valuable your product has become to your users and how much they’ve incorporated it into their routines.
To calculate this metric, you’ll just set your desired time period and then count up the number of times a use engaged with your product in that time period.
4. Feature usage rate
Now that we’ve discussed usage frequency, let’s talk about drilling it down even further. You don’t have to stop with figuring out how often customers are using your product. You can use the feature usage rate metric to determine the interactions users have with a specific feature within your product. When you identify a productive usage pattern within this metric, it can help you figure out what your most popular feature or offer actually is.
To calculate the feature usage rate, take the number of monthly active users of the desired feature and divide it by the number of user logins in a given period. Then multiply that figure by 100.
5. Time spent in-product
While usage frequency shows you how often your customers use your product, this metric indicates how long your users spend in your product. Ideally, you want to see customers spending a significant duration of time in your product.
6. Product stickiness
Essentially, this metric measures the number of people that are highly engaged with your product. If you have a high product stickiness rate, that means that your producted has been adopted and loved by users. If you’re able to identify positive usage patterns with your product stickiness metrics, then you’re likely to see high customer satisfaction and lower levels of churn.
To calculate this metric, simply divide your daily active users by your monthly active users.
Identify productive usage patterns in your product with Churnkey
With most subscription metrics, you can expect confusing graphs and painful data comparisons. And these products don’t actually fix the problem for you.
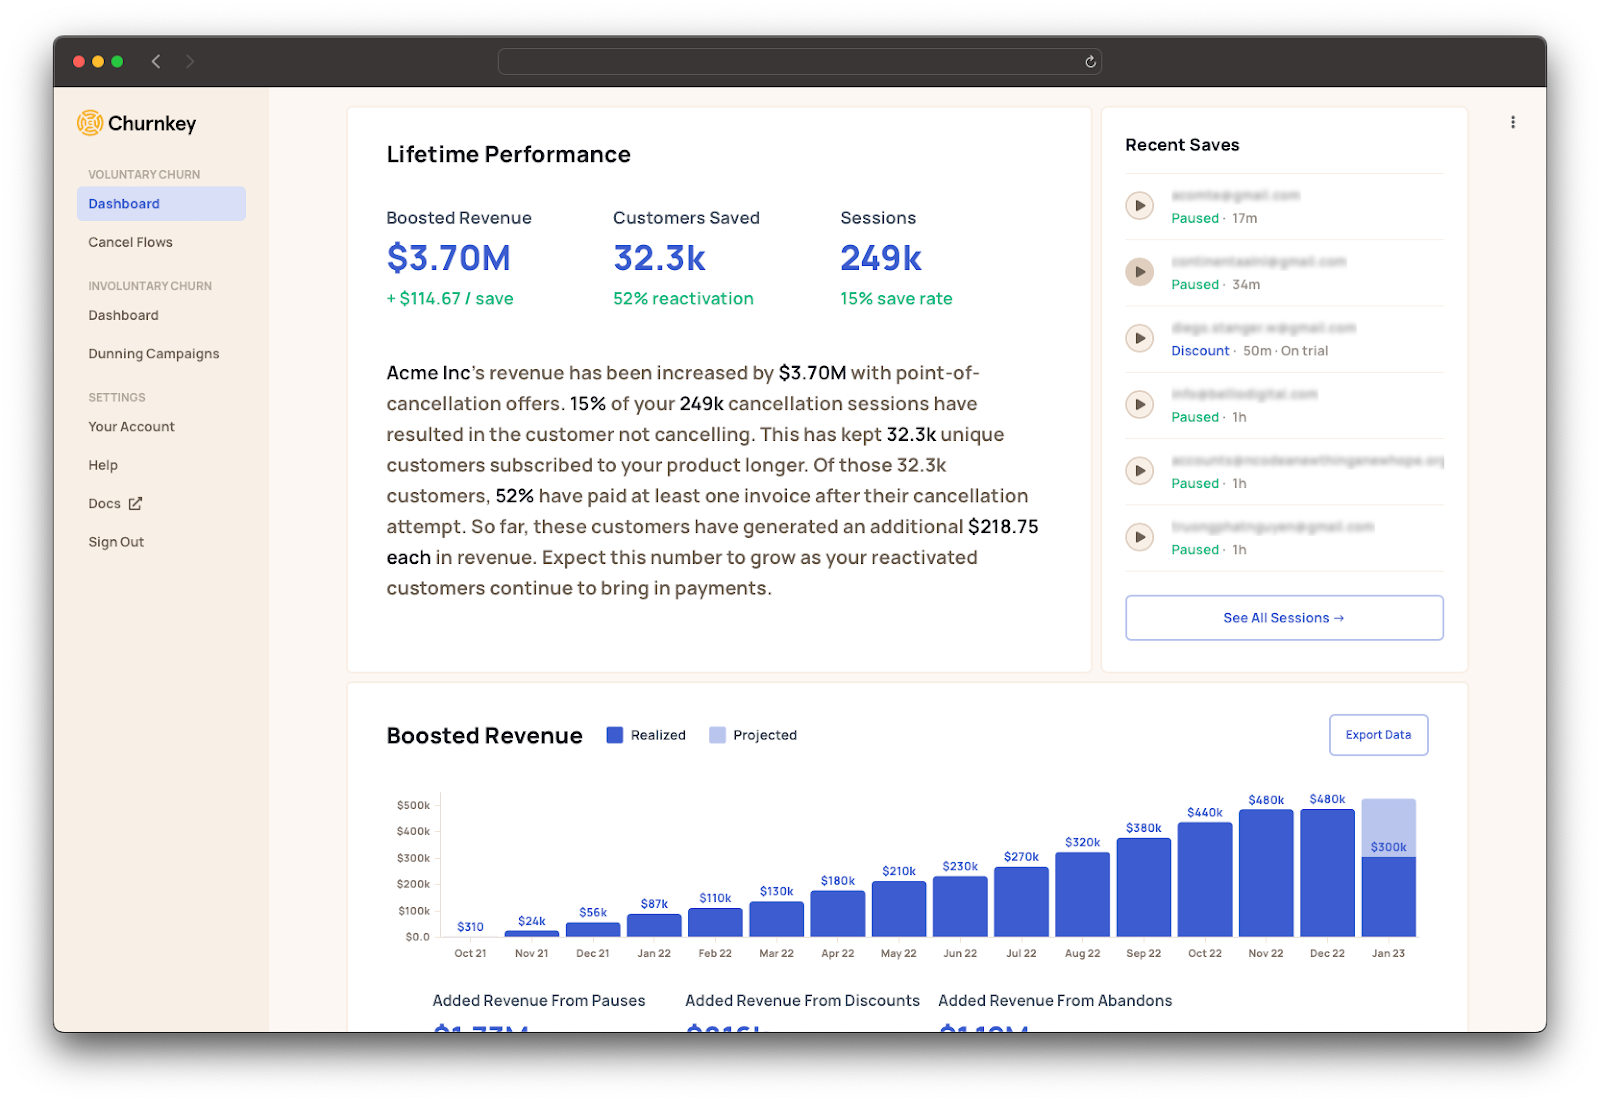
With Churnkey, all of your retention metrics are tracked in one place and optimized for maximum legibility, so you can easily identify productive usage patterns. You’ll be able to see how healthy your customer base is at a glance, understand the top reasons why customers leave, and what made them stay.
Better yet, we take it beyond data and analytics. Typical Churnkey customers see cancellations drop by 42%, failed payments recovered at rates above 68%, and LTV increased by 28%. Boost your MRR with a demo or start combating churn now with a free trial!


