How to Calculate TAM, SAM, and SOM
Understanding the distinction between TAM, SAM, and SOM provides the necessary data to validate your business model, align investor expectations, and set realistic revenue milestones.

TAM, SAM, and SOM are three metrics that form the foundation of any credible go-to-market strategy; they reveal whether you’re sitting on a gold mine or a niche too small to scale. Get them wrong, and you are either unprepared for challenges or setting growth targets that kill the business. Get them right, and you'll have the clarity to make smarter decisions, attract aligned investors, and build a business with room to grow.
Learn what TAM, SAM, and SOM mean, why each one matters, and how to calculate them step by step, with numbers rooted in reality.
TAM, SAM, and SOM: The Foundation and Calculations
Before we get started with calculations, we first need to have a working knowledge of what TAM, SAM, and SOM mean and why they’re important to your company.
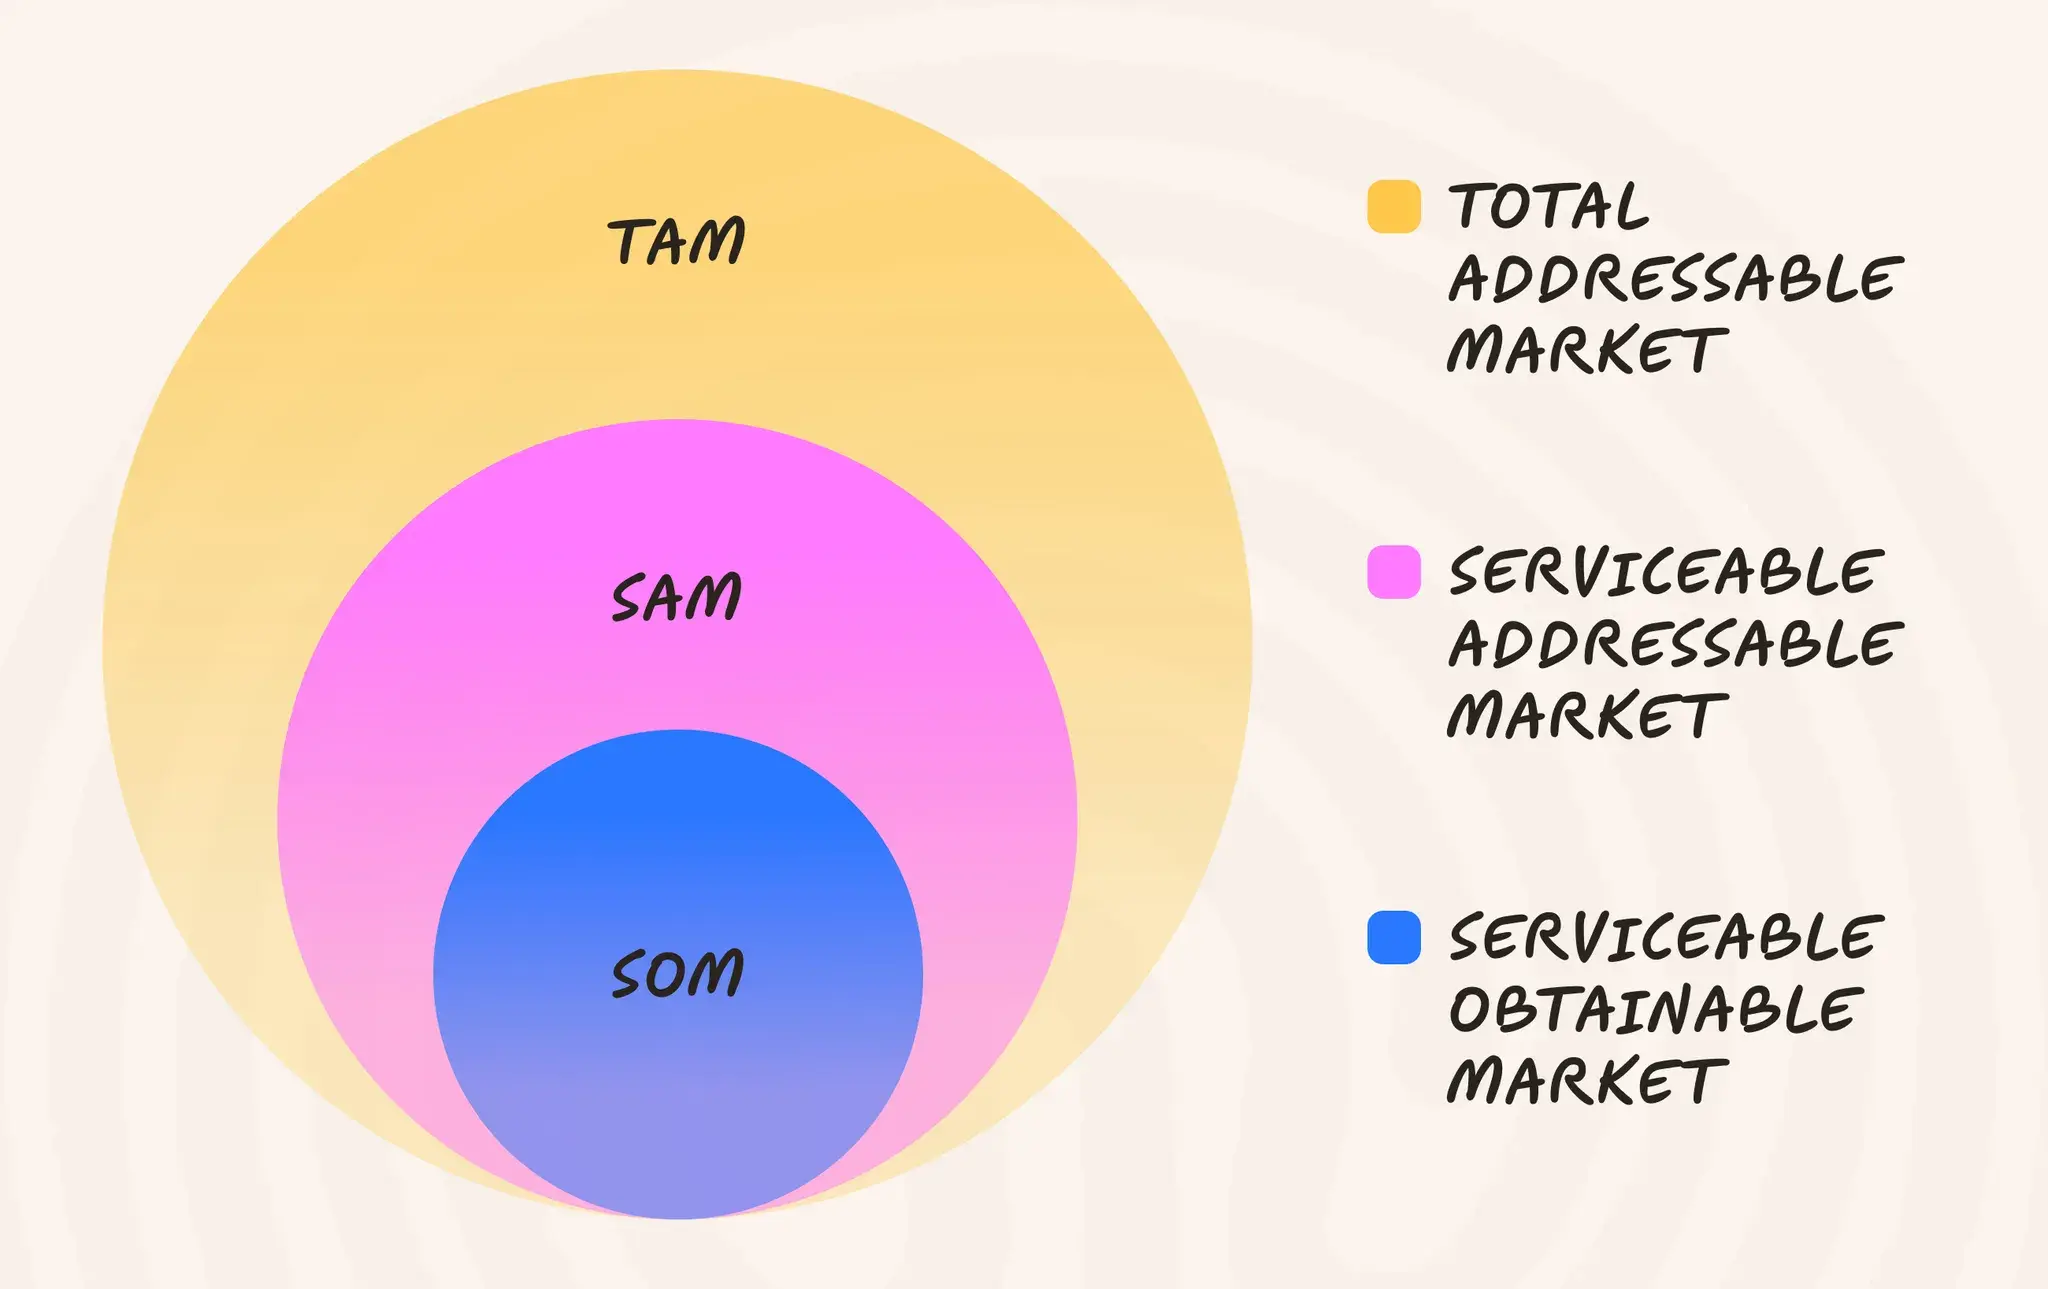
TAM (Total Addressable Market): The Theoretical Maximum
TAM (Total Addressable Market) is the total possible market available for your product or service. It is used to demonstrate your product or service’s potential. TAM is a great tool for estimating your company's maximum possible revenue by examining a specific market’s growth potential.
However, there's a trap many founders fall into: inflating TAM to make their opportunity look more impressive and drive more investments. But think of it as a Goldilocks problem: your TAM needs to be large enough to justify building a business, but realistic enough to be credible.
To calculate your total addressable market, use the formula below:
TAM = (# of accounts in a market) x (annual contract value)
The number of accounts in a market is determined by your market research. The annual contract value is determined by your company’s historical data of existing customers.
Here’s an example: if your company has a market of 6,000 accounts and your annual contract value (ACV) is $1,500, then your TAM would come out to $9M.
SAM (Serviceable Addressable Market): Your Realistic Reach
SAM (Serviceable Addressable Market) is the portion of your TAM you may be able to acquire based on specified customer demographics. Due to inherent limitations in your business model, such as geographic reach or product specialization, you won't be able to serve your entire addressable market.
Your TAM might be massive, but you can't serve all of it: geography, regulations, pricing tiers, and product fit all narrow down the portion that's within your reach. SAM is that section. It's where your business can compete, and it's the number that tells a story about your real opportunity.
The formula is:
SAM = (target segment of TAM) x (annual contract value)
Here’s an example: if your market is 6,000 accounts but only 3,333 of those accounts reside in the geographical area you serve, and your annual contract value (ACV) is $1,500 (as we already determined), then your SAM would come out to about $5M.
SOM (Serviceable Obtainable Market): Your Near-term Target
SOM (Serviceable Obtainable Market) is the sub-sector of your SAM that you can realistically target, given the limitations of resources, the presence of competition, and the level of market awareness. It´s the smallest number you calculate, because unless you’re a monopoly, you won’t be able to capture 100% of your SAM.
To calculate your serviceable obtainable market, divide your revenue from last year by your industry’s serviceable addressable market from last year. This percentage is your market share from last year. Then multiply your market share from last year by your industry’s serviceable addressable market from this year.
The formula is:
SOM = (last year’s market share) x (this year’s SAM)
And an example: if last year’s SAM was $4M and your revenue was $1.5M (37.5%), and this year’s SAM was $5M (as calculated above), then you’d multiply that by .375 to get a SOM of around $1.88M.
When and Why These Numbers Matter
TAM, SAM, and SOM are decision-making tools that matter at every stage of your business. Together, they turn market sizing from a one-time calculation into a strategic framework you return to every time the business faces a major decision.
For founders, they're a forcing function: they make them confront whether they're allocating resources to a market that can sustain the business long-term, or they're in a market that was always too small. Investors are digging into SAM and SOM because the numbers show whether you have a plan or just a big number.
Product teams need these numbers, too, because SOM tells them which customer segment to optimize for when building the next feature.
When to Use TAM: Post-launch and Budget Forecasting
Post-launch, TAM becomes one of the most useful checks you have, because it tells you whether the ceiling you assumed is still accurate as your market evolves around you. Industries consolidate, new competitors emerge, regulations shift, and the TAM you calculated eighteen months ago might look very different today.
On the forecasting side, TAM is not the number you're chasing, but it's the number that keeps your projections honest by reminding you where the hard ceiling is.
If your five-year revenue forecast is reaching your TAM, that's a signal you either need to expand your market definition, move upmarket, or build a second product line, because organic growth has a ceiling and you're approaching it.
- Calculate your growth ceiling for free.
When to Use SAM: Narrowing Your Focus
Use SAM when you're setting annual revenue targets, because your growth goals need to be anchored to the segment you're able to serve right now, not the entire market you hope to capture someday. It's also the right metric to focus on when you're making hiring decisions. If your SAM number tells you there are 5,000 companies that fit your ICP, that informs how big your sales team needs to be and how much pipeline you can generate.
When you're planning marketing spend, SAM keeps you disciplined: it's easy to justify broad campaigns by pointing at a massive TAM, but SAM forces you to ask whether you're targeting the right people or just burning budget on reach that won't convert. When entering a new vertical or expanding to a new geography, recalculate your SAM before you spend a dollar. What looks like a natural expansion on paper might be a much smaller serviceable opportunity than you assumed.
SAM is also the number investors want to see evolving over time; if it's growing, it means your product is becoming relevant to a wider addressable slice of the market, signaling that your positioning is working.
When to Use SOM: Your Realistic Target
When you're pitching investors on your next raise, SOM is what gives your revenue projections credibility. Anyone can point to a big TAM, but showing a realistic SOM demonstrates to investors that you understand how you're going to win.
Use SOM as your early warning system post-launch: if you projected capturing 3 percent of your SAM in year one and you're tracking at half that, something in your calculations was wrong. You need to figure it out before you scale spend.
It's also the metric to revisit before any major go-to-market change: a new pricing model, a new channel, or a new ICP. Your SOM shifts, and your forecasts need to reflect that before the decision is made, not after.
Connecting TAM, SAM, and SOM to Other Metrics
TAM, SAM, and SOM don't exist in isolation; they're only useful when you're monitoring them alongside related business metrics to see how efficiently you're capturing the target market. The most important connection is between SOM and CAC: if the cost to acquire a customer is growing while your SOM stays fixed, you're burning through your target market faster than you're monetizing it.
LTV changes the picture. A higher LTV allows you to justify the spend you need to capture your SOM. It means product decisions that improve retention aren't just good for revenue, they're expanding your effective go-to-market capacity.
- You can use our free LTV Calculator.
Churn is where most SaaS companies lose hold on their market math: if you're projecting SOM-based revenue growth but your churn rate (calculate your churn rate here) is draining the base you've already won, your growth slows, and no amount of new customer acquisition fixes a leaky bucket.
This is why customer retention has to be part of your market capture strategy. Tools like Churnkey exist because keeping the customers you've already converted is the most capital-efficient way to realize the SOM you've projected on paper. When you're setting revenue targets from SOM, the realistic version of that model accounts for your expected churn rate, your realistic CAC, and your average LTV.
Beyond Basic Calculations
Once you have multiple products or pricing tiers, your market size math gets more complex. In a product-led growth, this is especially important: your initial SOM might be based on a freemium or low-touch entry point, but the expansion revenue from those same accounts can represent a different, and often larger, revenue opportunity that needs its own SAM calculation.
International expansion is where TAM/SAM/SOM calculations fall apart, because founders apply their domestic calculations to new geographies without considering that pricing power, willingness to pay, competitive density, and sales cycle length can vary. A market that looks like a natural extension can take three times longer and cost twice as much to enter in practice. Stage your international SOM conservatively and build in currency and pricing adjustments from the start.
Market timing is the variable that makes or breaks all three metrics: in an emerging market, your TAM is growing faster than you can capture it. In a maturing or decelerating market, the window to capture your projected SOM may be narrower, and you need to be moving faster than the model requires on paper.
Conclusion: Making Your Numbers Work For You
TAM, SAM, and SOM are only as valuable as what you do with them after you've calculated them. The founders who get the most out of these metrics are the ones who are revisiting them every time the business changes. But none of it works if you're ignoring the customers you've already won, because the fastest way to shrink your effective SOM is to keep acquiring at the top of the funnel while losing ground at the bottom. This is the trap that kills otherwise well-positioned SaaS companies.
Retention isn't separate from your market capture strategy; it's central to it: every customer you keep is one less you have to re-win, and in a market where CAC is rising and competition is intensifying, that math matters more than most founders want to admit.


