B2B SaaS Churn Rate Guide, Benchmarks & How to Improve
Understanding your B2B SaaS churn rate is essential for evaluating marketing effectiveness and improving your bottom line.
What is a good churn rate? What is a healthy SaaS churn rate that keeps your subscription model sustainable and healthy?
Churn is unavoidable in any SaaS business. That’s why understanding your B2B SaaS churn rate is essential for evaluating marketing effectiveness, improving your bottom line, and doubling down on your customer retention strategies.
One useful exercise is to imagine an investor asking for your business’ churn rate. What will you present to them? Are you aware of the metrics they’re interested in and which indicators are important in the evaluation?
Let’s dive into everything you need to know about B2B churn rates for SaaS. As churn experts at Churnkey—we help you understand why your customers cancel their subscriptions and help you retain them with personalized offboarding experiences—buckle up for a collection of tips, benchmarks, and suggestions to improve your churn rates.
Churn Rate: Definition & How to Calculate It
First, let’s define what we mean by “churn rate.”
Churn rate calculates the number of customers who cancelled their subscription within a specific time period. It can be used to measure revenue lost from churned customers.
SaaS churn rate is crucial for a company’s long-term survival and overall performance.
Customer Churn Rate
Customer churn rate focuses on the number of customers that quit your services monthly or annually. To calculate customer churn, you need to divide the total number of churned customers via the total number of customers:
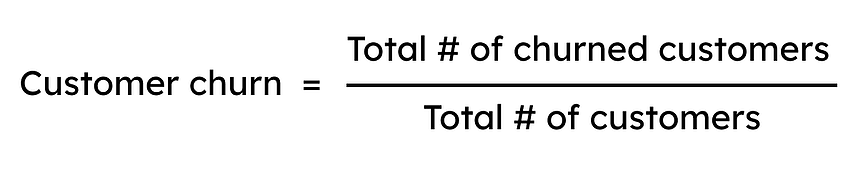
For example, if your business has a total of 100 customers and 8 of them ended their subscription last month, your customer churn rate is 8%. Customer churn is also known as “logo churn.”
Net Logo Churn
To get an even more precise calculation, there’s the net logo churn metric which takes into consideration the number of new customers your business acquired over a given period.
To calculate it, you need to divide the total number of churned customers minus the new customers acquired over a period via the total number of customers.

For example, if your business has 100 customers, 8 of which ended their subscription last month, while your business acquired 2 new customers, your net logo churn would be 6%.
Customer retention is a great overall metric to keep track of your customer base and product experience. However, since it doesn’t provide actual insights into the revenue impacted by the churned customers, it’s often combined with the revenue churn rate.
Revenue Churn Rate
The revenue churn rate measures the percentage of lost revenue due to downgrades, cancellations, payment failures, and other reasons. To calculate it, you need to divide the total churned revenue over a period via the total revenue at the beginning of that period.
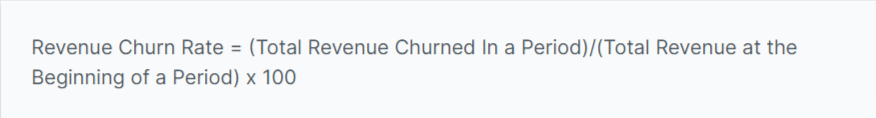
For example, if your total business revenue is $1,000 and your churned revenue is $150, your revenue churn rate is 15%. What makes revenue churn special is that it takes into consideration the different pricing tiers you set for your subscription models, which are not measured by the customer churn.
There is also the net revenue churn which measures the revenue generated from expansion, such as upsells, add-ons, or tier upgrades. This gives you more precise insights into the actual revenue lost and gained. To calculate it, you need to divide the total churned revenue minus the expansion revenue via the total revenue at the beginning of the period.

For example, if your business generated $1000 and your churned revenue is $150, but you also generated an additional $80 from expansion, your net revenue churn will be 7%.
Recurring Revenue
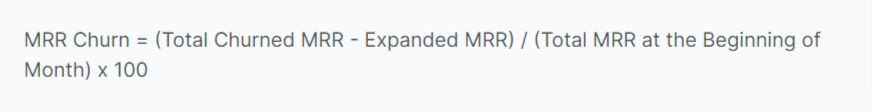
If your business is operating monthly, another critical metric to calculate is the Monthly Recurring Revenue (MRR) Churn. To calculate it, you’ll need to divide the total churned MRR minus the expanded MRR via the total MRR at the beginning of the month.
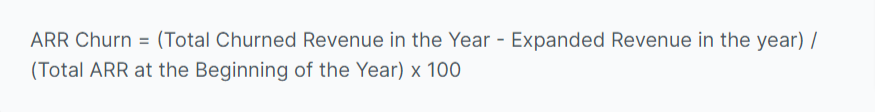
Similarly, you can find your Annual Recurring Revenue (ARR) churn if your business operates on an annual basis. Again, you will need to divide the total churned revenue minus the expanded revenue via the total ARR at the beginning of the year.
If you want to estimate retention, you can calculate Gross retention, Net retention, or Logo retention. Retention allows you to track how efficiently you keep existing customers happy and generate revenue from them.
For example, you might be able to maintain all your customers for over a year, but if they’ve all downgraded to lower pricing tiers, this can significantly impact your revenue. That’s why it’s essential to track your retention as well.
B2B SaaS Churn Challenges
In contrast to B2C businesses that cater more to individuals and prosumers (e.g., freelancers paying for professional tools), B2B businesses don’t lose individual users but entire teams of users when they churn. Think of B2B SaaS as a tool for companies to do their work better. This dynamic introduces new challenges for customer retention:
- Premium customer service is key. Larger enterprise clients expect premium customer support for their purchased services to tend to their more complex needs. If your B2B fails to deliver, the consequences might result in high churn rates. If you have an enterprise package, consider having account managers that can provide guidance around using your product. Account managers can also spot opportunities to upsell and cross-sell your other services.
- Employee turnover affects long-term business. Account managers and salespeople are vital in forming relationships with enterprise clients and fostering customer loyalty. That’s why B2B companies need to invest in additional resources to retain talent and keep their employees happy and productive.
- Small- or medium-sized businesses may fail. While this may also be an issue for B2C businesses, having big teams from failing companies suddenly cancelling their subscriptions can cause dent revenue growth.
Average Churn Rates for B2B SaaS
Churn is a part of life for every subscription business. That’s why it’s essential to benchmark churn rate ranges so you’re realistic about the health of your business. We’ve had a number of conversations, for example, with teams who want to settle their churn rate to around 10%. While that’s a nice, round number, it essentially means that your business will be changing out their customer base every 10 months.
Here are the average B2B churn rates:
| Smaller Companies | Larger Companies | |
|---|---|---|
| Logo Churn Rate | 3-7% | 1-2% |
| Net Revenue Churn Rate | 10-15% | 5-7% |
| Gross MRR Churn Rate | 2-2.5% | 1% |
| Net MRR Churn Rate | 2% (most companies) |
Benchmarking is not a business panacea, although it helps look to your industry so you can improve performance and adapt procedures for optimal results.
Learn how to convert monthly to annual churn and vice versa.
Factors to Consider
Now that we’re on the same page about churn rate and the different ways to calculate it, let’s dive into the different B2B SaaS churn rate benchmarks. While the average churn rate varies by industry, general patterns are collected from data that help review your growth path.
SaaS benchmarking is vital as a way to compare performance and measure success.
However, it can quickly turn into a curse if B2B businesses lose sight of the right metrics to track and get drowned in the data. That’s why SaaS tools need to focus on set metrics that are relevant to their growth and focus towards improving them.
Here are some factors that could impact a churn rate since there’s no one-size-fits-all.
- Company size. Usually, larger companies have lower churn rates since they’ve had time in the market to establish their clientele. In addition, their clients are usually extended contracts that can’t churn, and what’s more, those clients don’t have the same budget concerns as medium or small ones.
- Voluntary or Involuntary churn. Voluntary churn is based on customer decision
to quit a SaaS service or downgrade to lower packages for different reasons, such as poor customer support, low-quality products, or high pricing tiers. Involuntary churn is when a customer didn’t intend to cancel their subscription but churned anyway, usually due to payment issues. Voluntary and involuntary churn rates should be examined separately.
- Product Type. Sometimes software might be core for a business, while other times marketing or HR tools might be considered an extra luxury. That’s why certain businesses have slower growth as they’re trying to establish their “nice-to-have” products in the market compared to other “must-have” tools.
- B2B vs. B2C. B2C companies often have higher churn rates (around 5.06%) than B2B companies (around 4.67%). That’s mainly because B2B companies make more expensive investments and commitments in the long run, securing more loyal clientele.
- World Events. The Covid-19 pandemic definitely impacted the average churn rates for SaaS companies. For example, software like Zoom experienced massive growth, while others serving in-person markets experienced the highest churn rates.
How to Improve Your B2B SaaS Churn Rates
Naturally, there’s no magic wand you can wave, and suddenly your churn rates vanish. As we said before, churn is unavoidable, so you might as well learn to live with it and invest in strategies that can help reduce it.
There are some concrete steps you can take to reduce your B2B SaaS churn:
- Sell more annual contracts. Annual contracts are the easiest and fastest way of improving churn rates since clients are bound to your services for at least a year. Not only that, but usually, customers investing in long-term contracts are the ones who are not budget conscious and choose your services because they trust your company. To increase your annual contracts, you can highlight the savings compared to monthly plans for new customers or email existing customers and offer an attractive discount on annual plans.
- Focus on upsells and cross-sells. Upsells encourage users to invest in premium pricing tiers for software while cross-sells suggest purchasing additional related features like integrations, training, or premium support. These tactics allow you to get the most out of your current customers by generating additional revenue without spending more budget to attract new leads.
- Reduce your involuntary churn. Approximately 20-40% of churn is caused due to payment issues from credit card failures; that’s why SaaS businesses need to invest in a solid plan to reduce involuntary churn.
- Improve your onboarding experience. Your onboarding is the first image customers get from your business which sets the tone for the overall customer experience. In order to improve your churn rates, you need to revisit your onboarding processes and make sure everything is comprehensible and applicable for new customers. For example, it can be helpful to establish a knowledge base packed with tutorials and instructions that allows customers to easily spot the information they’re looking for.
- Improve your churn rates with offboarding experiences and personalized cancel flows. Investing in a product like Churnkey will help you offer customized deals to the customers who decide to unsubscribe while helping you understand why they churn in the first place. This way, you can get a clearer picture of which aspects of your product didn’t work and how to minimize the impact on your overall growth.

Key Takeaway
The easiest way to tackle churn is using Churnkey to get real insights on why your churn occurs. Once you find actionable solutions to reduce cancellations, you’re on the path to achieve more sustainable and healthy churn rates.


