Gross Retention vs. Net Retention vs. Logo Retention: What They Are & How to Optimize Them
Learn how to properly track these important SaaS Metrics and better understand what they mean for your business.
Gross retention, net retention, and logo retention tell different stories about your business health, and mixing them up can lead to misguided decisions about where to focus your retention efforts.
Knowing the difference shows if you're growing or just masking churn with expansion revenue. For example, a company with 95% gross retention and 110% net retention is in a different position than one with 85% gross retention and 110% net retention.
In this guide, I'll explain what each retention metric measures, how they differ, and how to optimize them to build a retention system that drives growth.
What Each Retention Metric Measures
Gross retention, net retention, and logo retention are calculated using different formulas. Although they might look similar, the insights they provide are radically different.
Gross Revenue Retention (GRR)
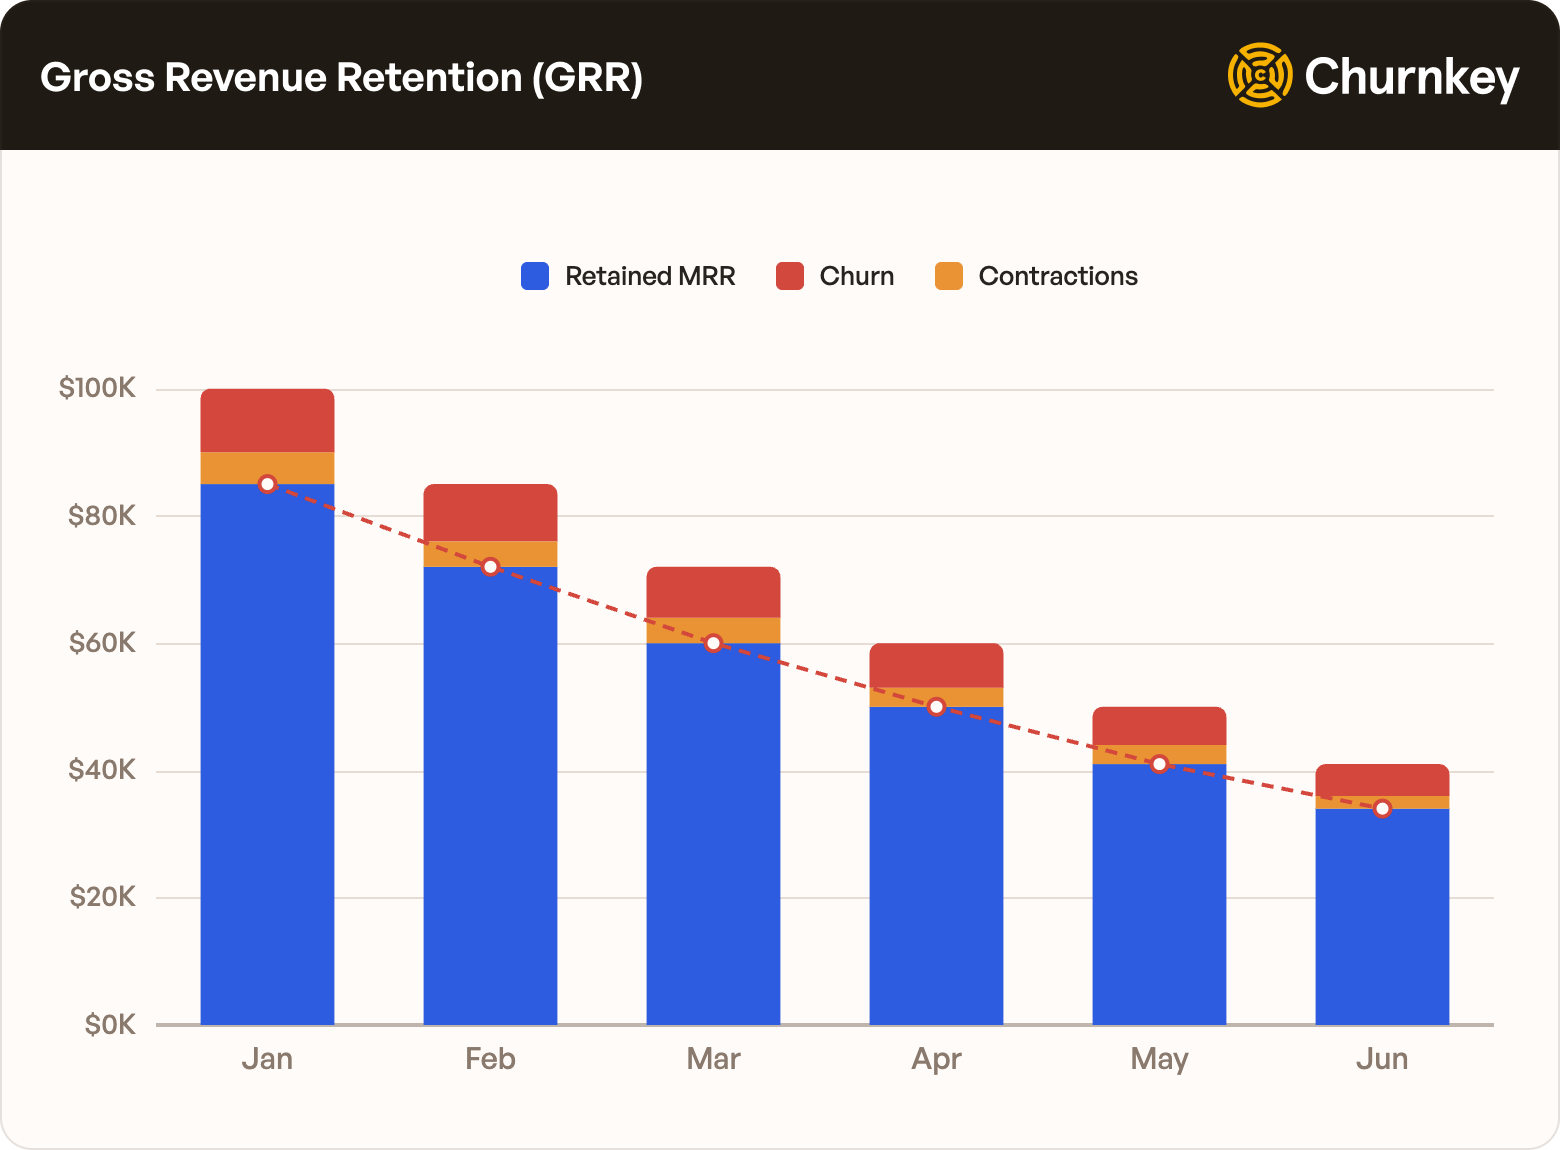
GRR shows how much revenue you're earning from your existing customer base without the safety net of expansion revenue to make things look better. It's the foundation on which everything else is built.
The formula is simple: take your starting MRR, subtract any revenue you lost to churn and downgrades, then divide by your starting MRR and multiply by 100.
GRR = (MRR at the start of the month - Churn - Contractions) / MRR at the start of the month

If you started January with $100K in MRR, lost $10K to customers who canceled, and another $5K from customers who downgraded their plans, your GRR is 85%. Even if your net retention looks healthy at 110%, with 85% GRR, you've got a serious problem that expansion revenue is hiding.
Strong GRR means your core product is sticky enough that customers aren't leaving or downgrading
Case study: For high-growth companies like Superhuman, GRR is about protecting the baseline. By implementing Churnkey, they turned potential downgrades into opportunities for feedback and price optimization, guaranteeing their core revenue stayed within the business.
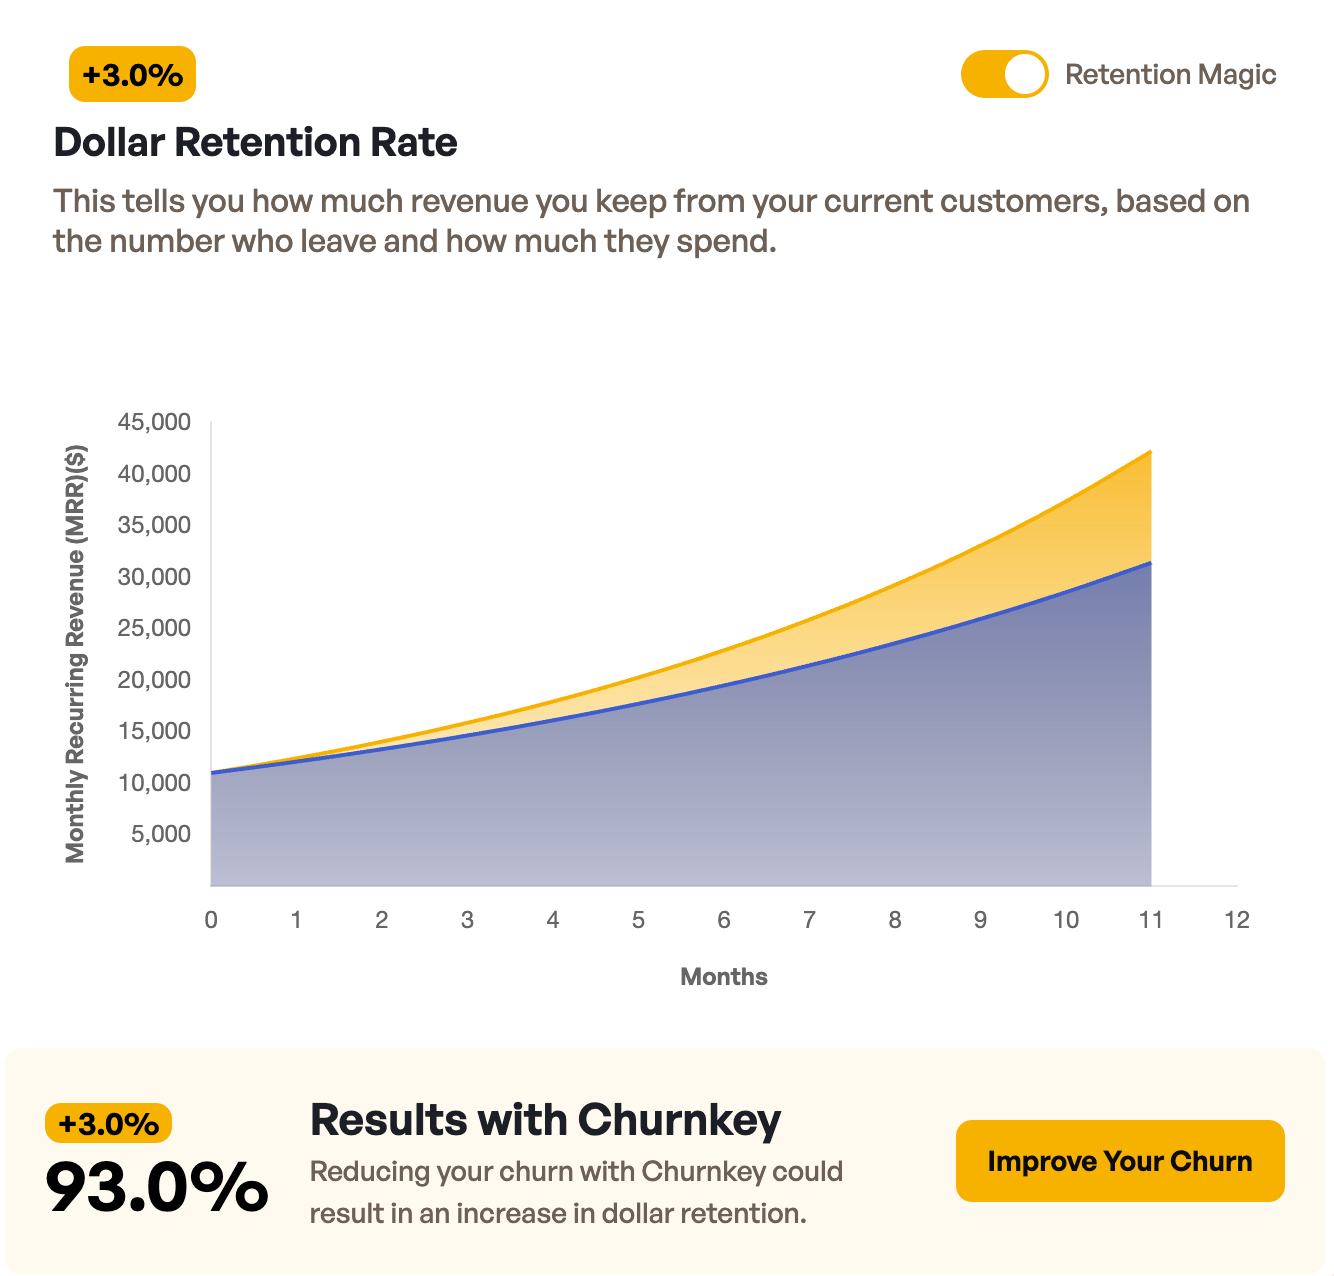
If you aren’t sure where your baseline stands, use Churnkey’s Dollar Retention Rate Calculator. It helps you strip away the "noise" of new sales so you can see the raw percentage of recurring revenue you are keeping.
Net Revenue Retention (NRR)
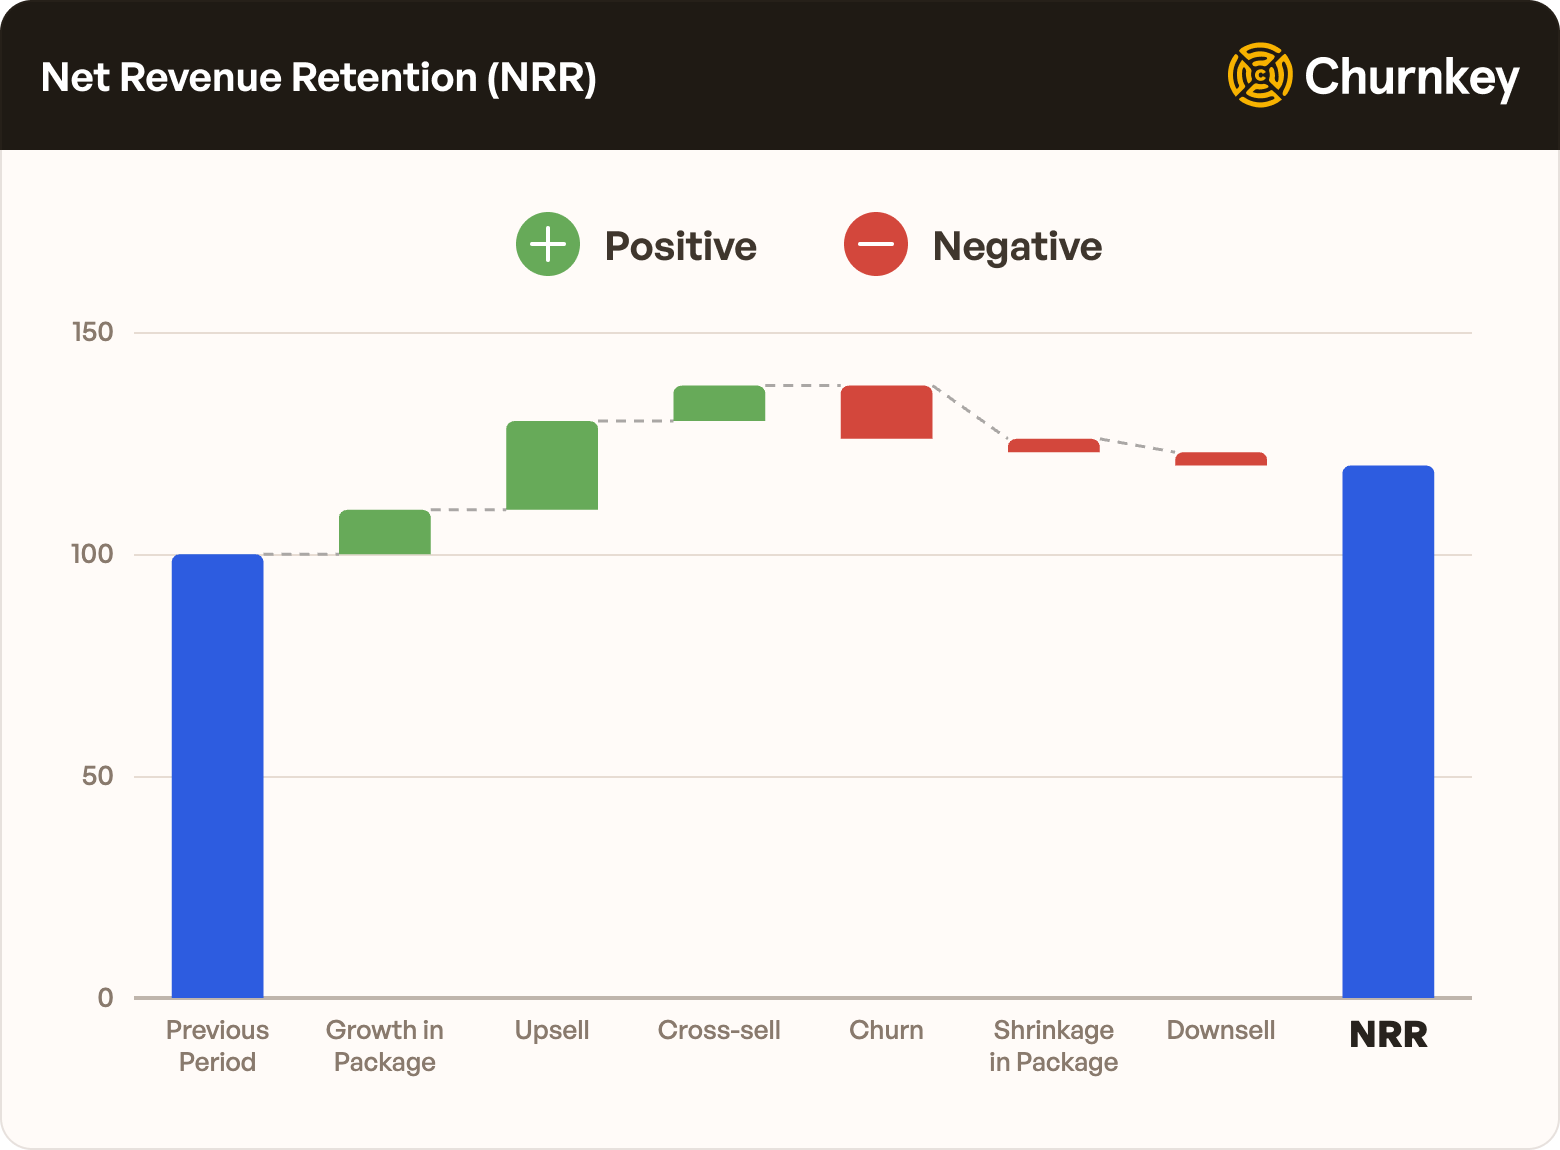
NRR shows you how your expansion strategy is working. The formula takes the starting MRR, subtracts churn and downgrades, adds expansion, then divides by starting MRR and multiplies by 100.
NRR = (MRR at the start of the month + Expansion - Churn - Contractions) / MRR at the start of the month

If you started with $100K MRR, lost $15K to churn and downgrades, but your existing customers expanded by $35K through upgrades and additional seats, that gives you 20% growth, or 120% NRR. An NRR above 100% means your existing customer base is growing your business without new customer acquisition.
However, anNRR above 100% can mask a gross retention crisis if you're losing tons of small customers while a few enterprise clients are expanding enough to cover it up. Even if your NRR is fantastic, you may still be having a hidden churn problem.
Net retention is heavily influenced by the lifetime value (LTV) of a customer.
"Because of Churnkey, our marketing team was able to design the best exit funnel that increases LTV, reduces churn, and gives us the right insights to reactivate users." - Austin Distel, Marketing at Jasper
Logo Retention
Logo retention is valuable for understanding product-market fit and customer satisfaction. If people are leaving regardless of how much they're paying, your product has a problem, and logo retention tells you whether you've built something people want to keep using.
The formula is as follows: take the number of customers at the end of the month, subtract any new customers you acquired, divide by the number of customers you started with, and multiply by 100.
Logo Retention = (Total customers at end - New customers acquired)/Total customers at start
If you started January with 100 customers and ended with 85 (after losing 15), your logo retention is 85%. The problem is that logo retention treats every customer as equal, which means losing a $50/month customer counts the same as losing a $5,000/month enterprise client.
How to Calculate Each Retention Metric Correctly
The most common mistake in calculations is including new customer revenue in your retention calculations, which undermines the purpose since retention metrics are supposed to measure what happens with your existing customer base, not the fresh revenue you just acquired.
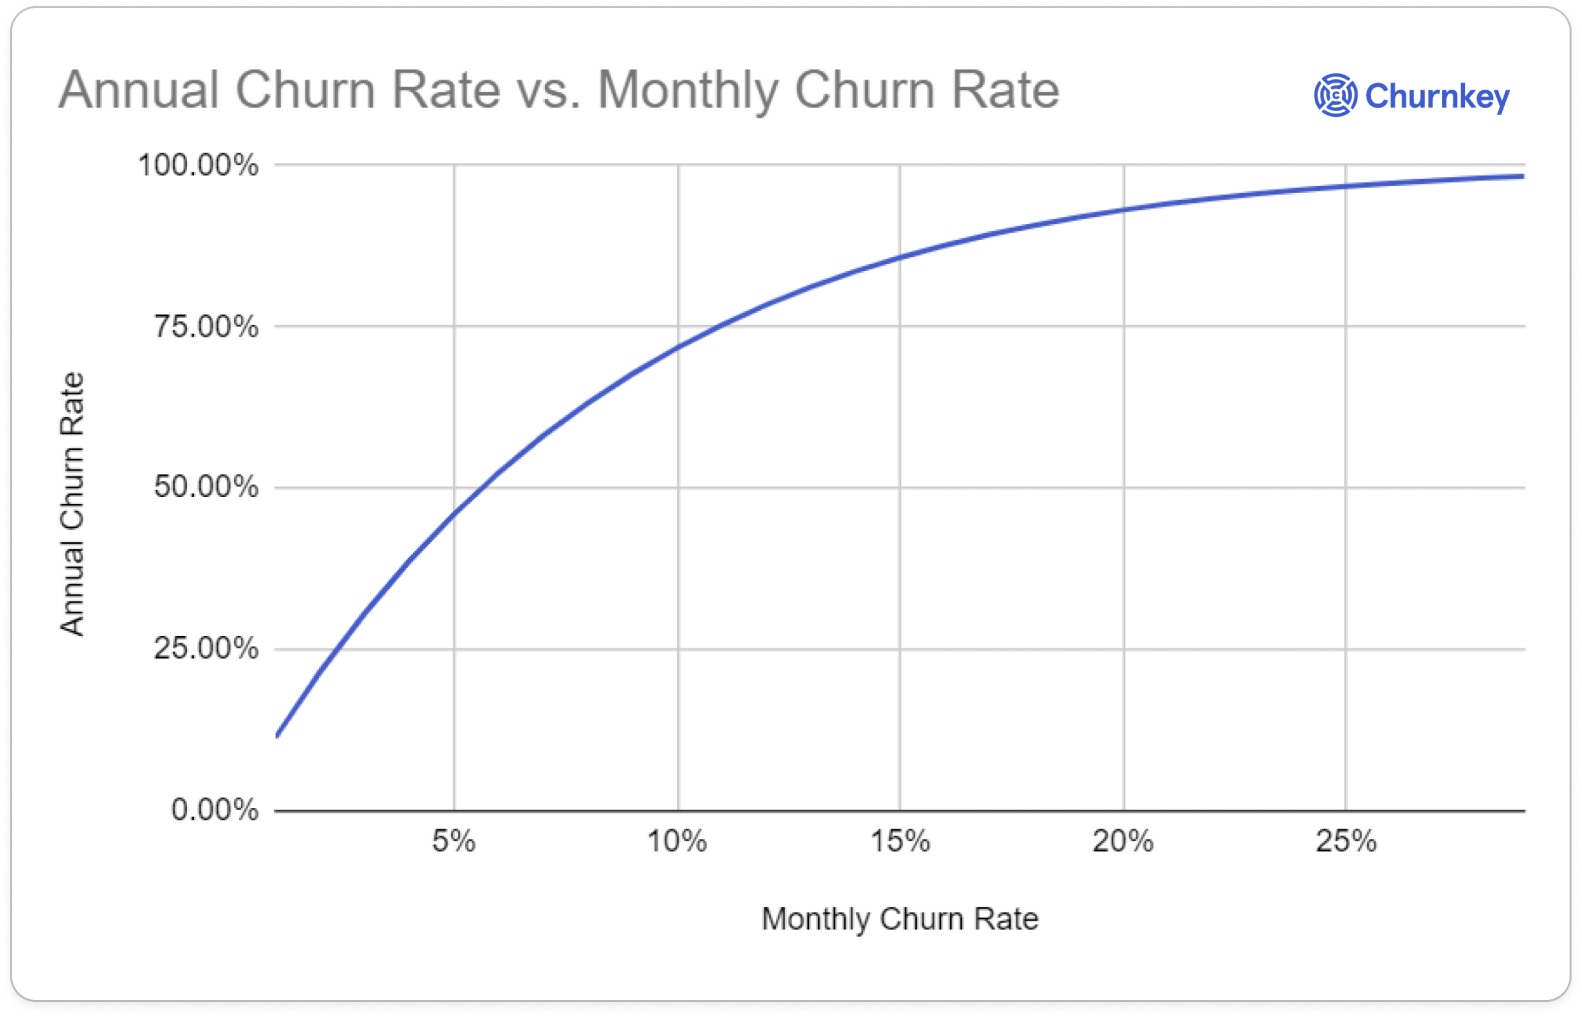
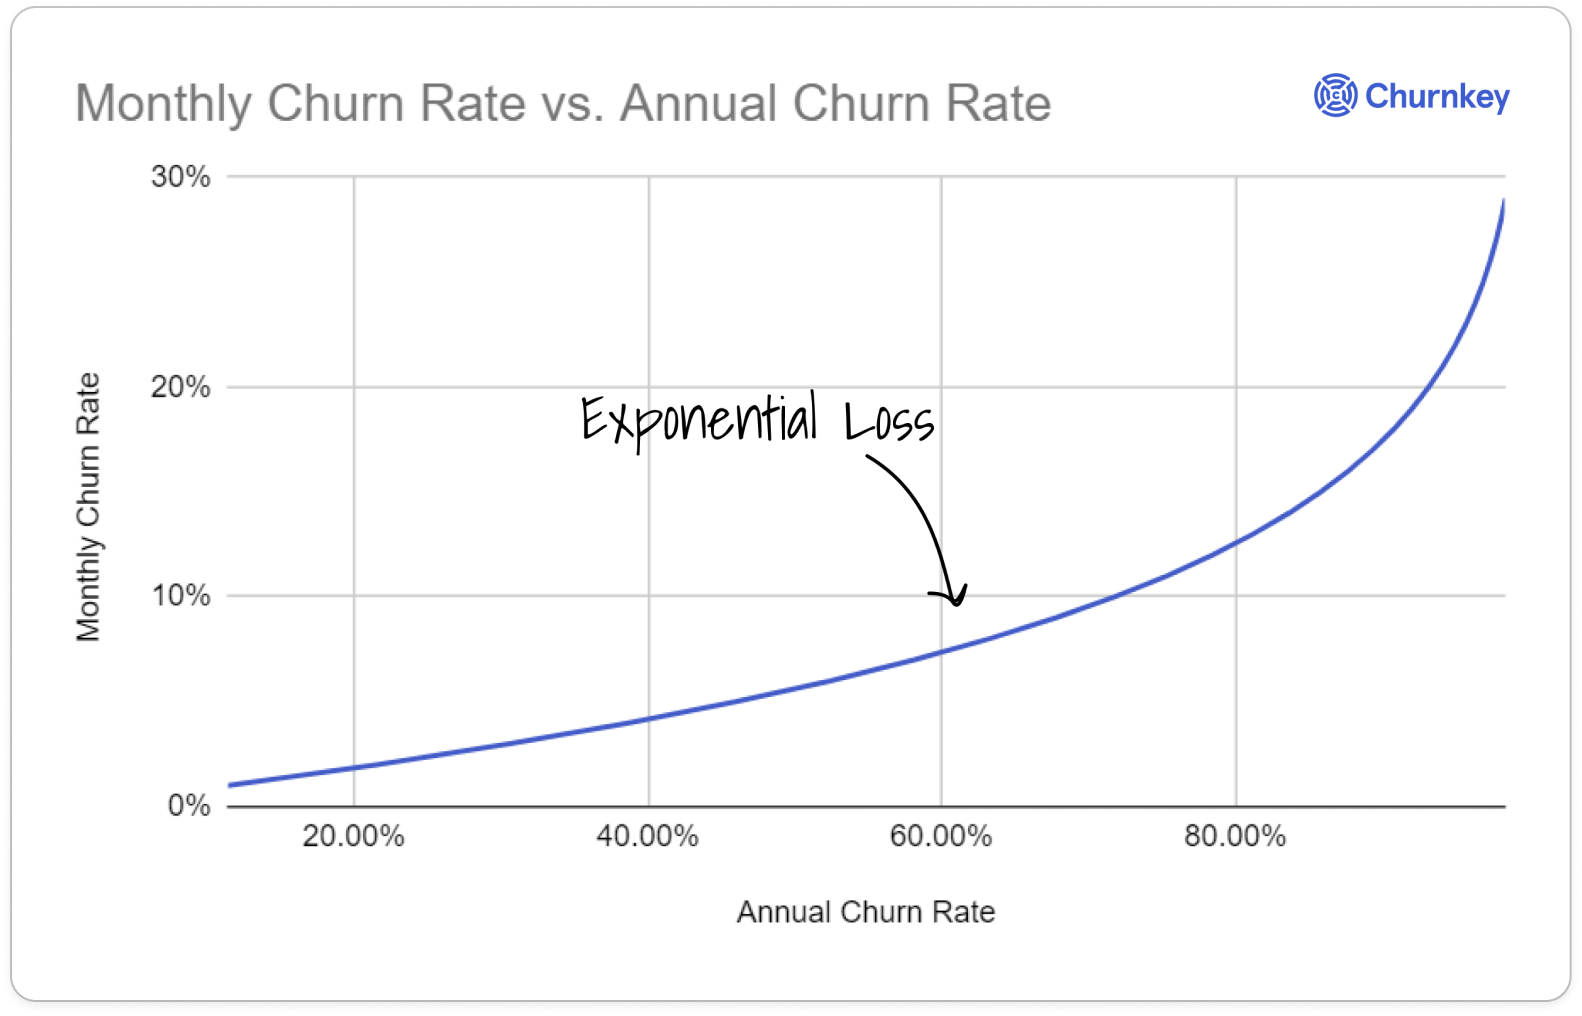
Another trap: mixing monthly and annual contracts in the same calculation without annualizing everything first. This presents misleading numbers because a monthly customer churn has a different impact than an annual customer leaving.
The grace period problem: Many teams don't have a clear definition of when churn happens. A customer clicking "cancel" on day 15 of a 30-day billing cycle hasn't churned yet; they're still paying you and using your product. Measure churn at the end of the service period when revenue stops, but track "cancellation intent" separately as an early warning signal.
Reactivation revenue: If a customer churns in January but comes back in March, that's not negative churn or improved retention; that's a new customer acquisition. The best way is to treat any customer who's been gone for more than 30-90 days as a new customer in your metrics to avoid artificially inflating the retention stats with win-back revenue.
What to include and exclude from gross retention, net retention, and logo retention calculations:
Special Note on Usage-Based Pricing Models
If you're running a usage-based pricing model like Snowflake (compute and storage consumption) or Twilio (API calls and messages), revenue can be volatile month-to-month depending on customer activity. A customer might run massive data workloads in Q4 but minimal usage in January, and that's not churn, it's just their business cycle.
To keep your retention metrics clean and prevent a single "quiet month" from looking like a massive churn event, most experts recommend using a trailing twelve-month (TTM) average for usage revenue when calculating retention. This smooths out the natural volatility and gives you a more accurate picture of whether you're retaining customer value or if they're reducing their commitment to your platform.
Gross Retention, Net Retention and Logo Retention Key Differences Comparison
The table below breaks down what each metric measures, how often to track it, what benchmarks you should aim for, and who should be paying attention.
When Each Retention Metric Matters Most
Although all three retention metrics matter, which one deserves your immediate attention depends on your company stage, business model, and what problem you're trying to solve.
- For an early-stage startup still finding product-market fit (pre-$5M ARR), logo retention is often the North Star. You need to prove that customers want to stick around and use what you've built, and you should be hitting 85-90%+ before you even think about expansion strategies.
- Once you hit the growth stage ($1M-$2M ARR), focus on gross retention because you're now proving you can retain revenue at scale, and anything below 90% GRR signals that your foundation isn’t strong.
- At the scale stage ($20M+ ARR), net retention is what investors care about most, and if you can achieve net negative churn (where expansion revenue exceeds all churn and contraction), it means your existing customer base grows your business without acquiring a single new customer.
Your business model also sets priorities. For example, PLG/self-serve companies and enterprise SaaS businesses can survive at different gross, net, and logo retention rates.
Pick your primary metric based on what stage you are right now, but never let the other two metrics fall off your radar.
What Average Gross Retention, Net Retention, and Logo Retention Look Like: Benchmarks by Context
Knowing what "good" looks like is useless without context; a 90% logo retention rate might be excellent for a $5K ACV product but a disaster for a $100K enterprise solution. The most accurate way to benchmark your retention metrics is by annual contract value (ACV), because companies selling at similar price points face similar customer dynamics, sales cycles, and support requirements.
Average gross retention and net retention for private SaaS companies
For public SaaS companies, a healthy NRR typically averages around 114%, with top-tier performers hitting the 110 - 130% range. A GRR of 95 - 100% ensures that the company’s core revenue base stays intact. Meanwhile, average logo retention sits around 85%, and, unlike revenue retention, this metric represents your total customer count, so it can’t exceed 100%.
How to Improve Each Retention Metric
Improving retention metrics isn't about solving everything at once; it's about diagnosing the specific problem and applying the right fix at the right time.
Improving logo retention:
- Onboarding optimization: the first 90 days are critical for establishing product value and usage patterns.
- Usage monitoring and intervention triggers: catch engagement drops before they become cancellations.
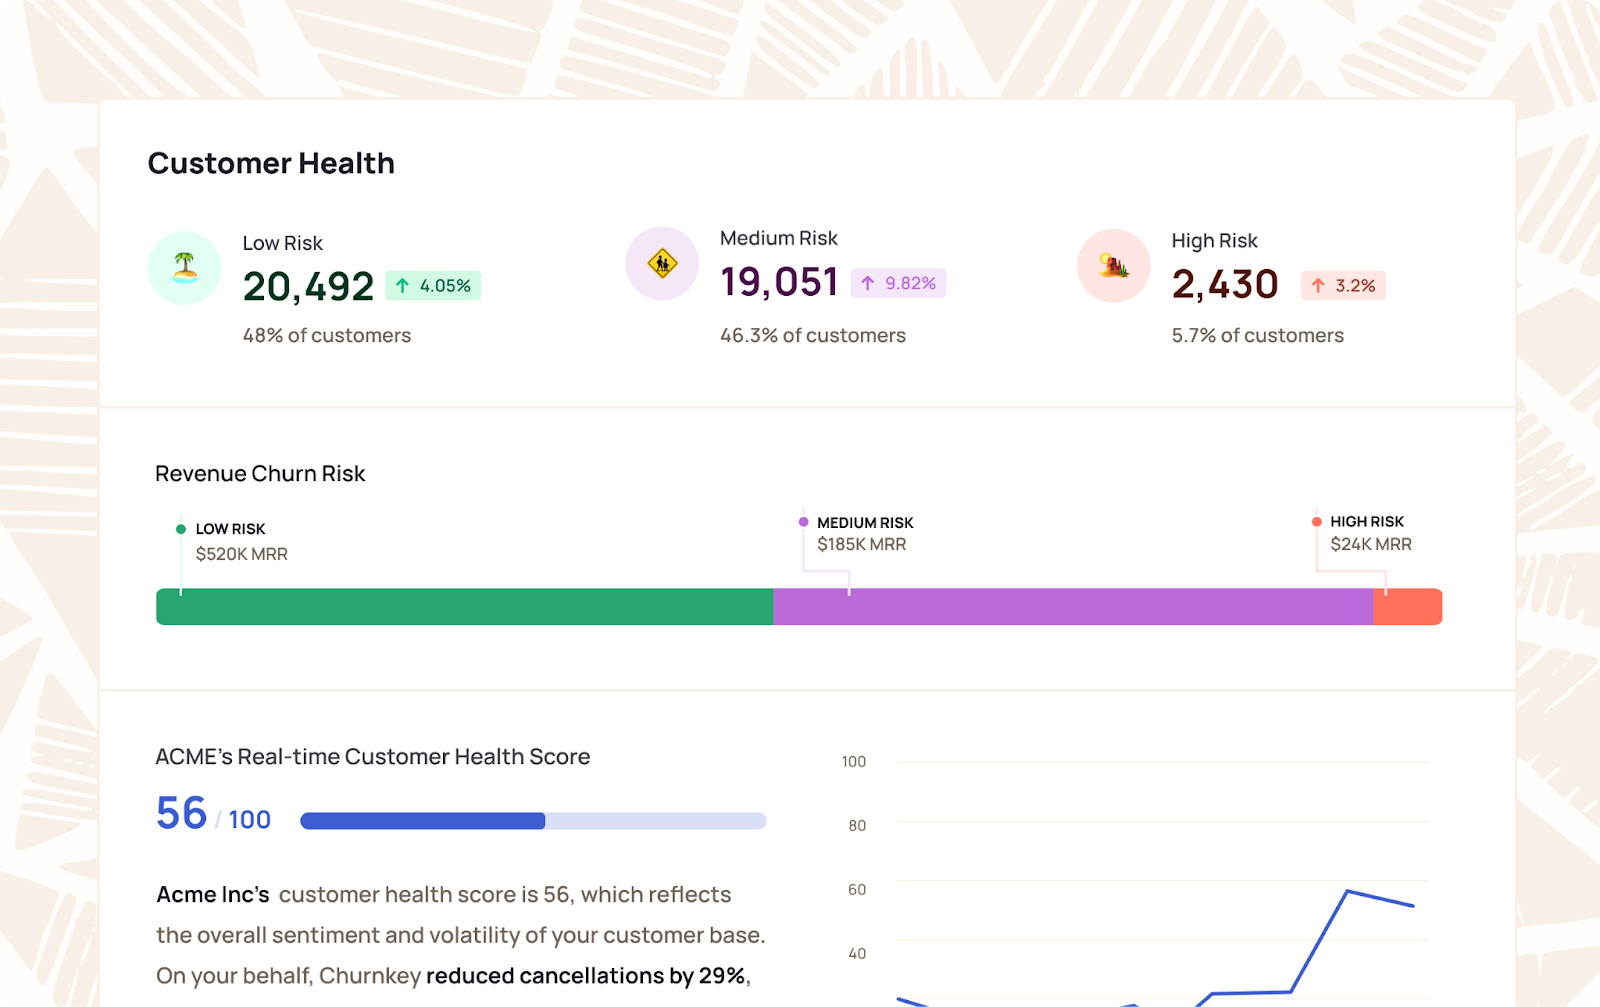
- Customer health scoring: identify at-risk accounts before they're already gone
- Proactive outreach based on engagement drops: reach out when activity declines, not after they've already decided to leave.
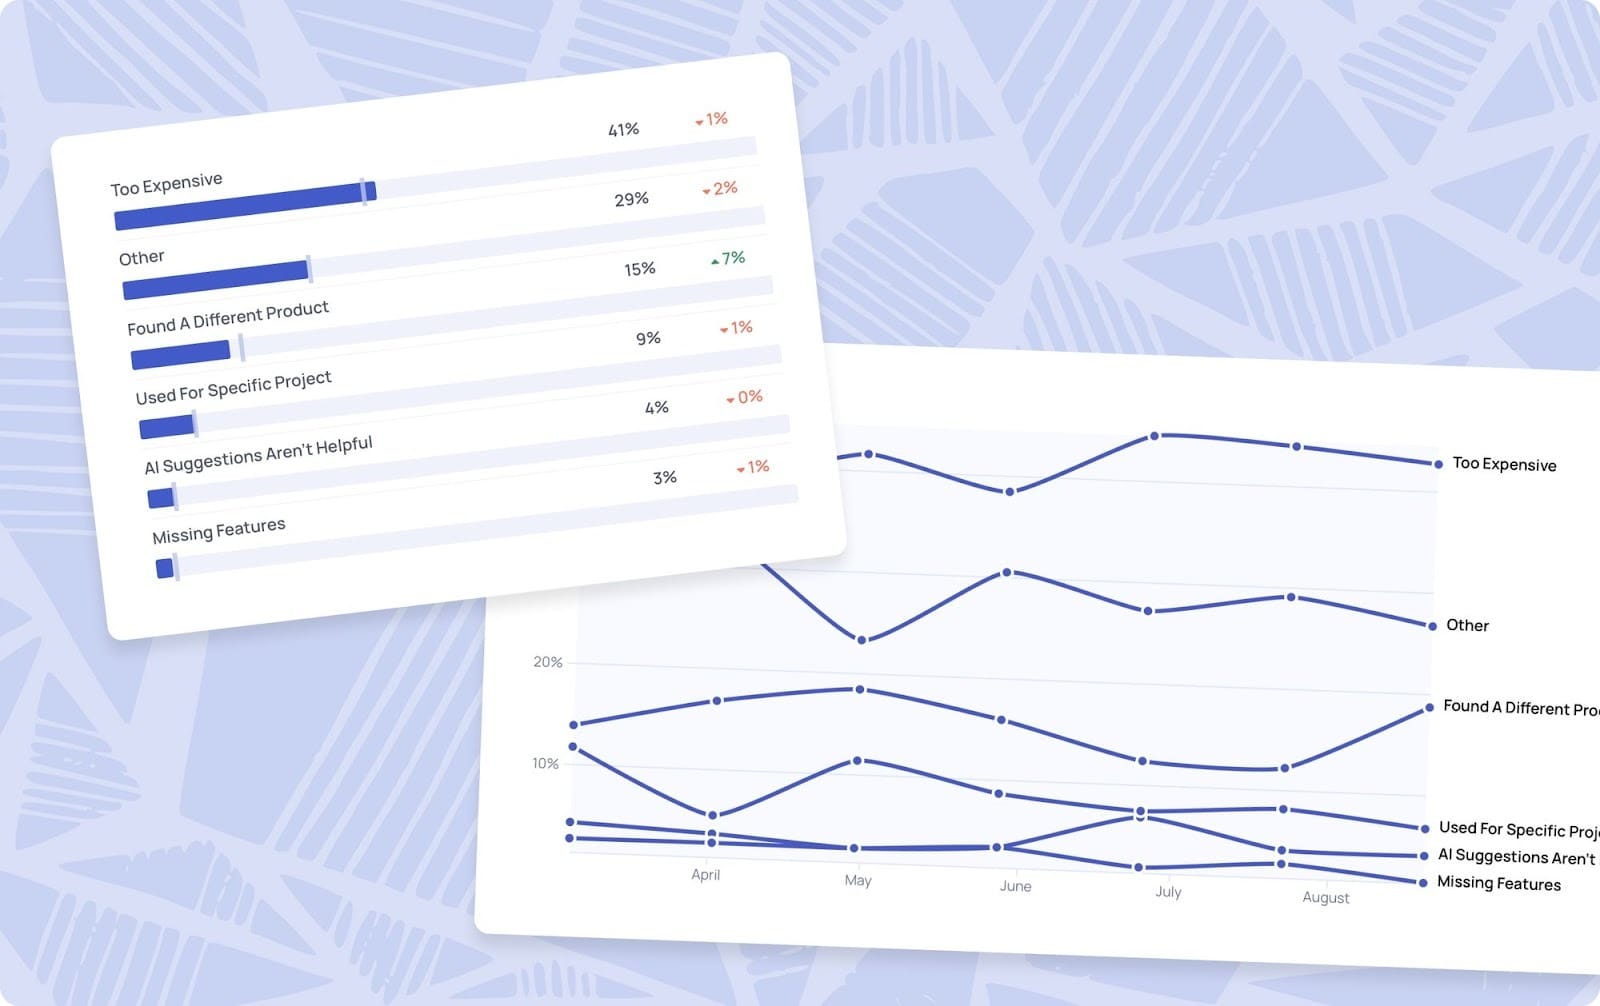
- Product improvements based on churn reasons: fix the actual problems driving customers away.
- Right-fit customer acquisition: stop selling to bad-fit customers who inflate your acquisition numbers but destroy your retention
Improving gross revenue retention (+ everything from logo retention):
- Prevent downgrades through usage monitoring: spot accounts that might contract and intervene before they do
- Lock in annual contracts vs. monthly: reduce the frequency of churn opportunities.
- Early renewal conversations: don't wait until 30 days before contract expiration
- Value realization: continuously demonstrate ROI so customers never question renewal
- Reduce involuntary churn from failed payments: this is where Churnkey fits into your retention stack by recovering revenue you're losing to billing issues.
- Pricing structure that reduces contraction risk: avoid plans that make downgrades easy or attractive.
Improving net revenue retention (+ everything from logo and gross retention):
- Expansion revenue motions: systematic upsells and cross-sells, not random opportunistic pitches.
- Usage-based expansion opportunities: let product adoption drive revenue growth.
- Strategic account planning: identify expansion potential before customers ask for it.
- Multi-product strategy: expand wallet share with complementary solutions.
- Seat expansion programs: make it easy for satisfied teams to bring on more users.
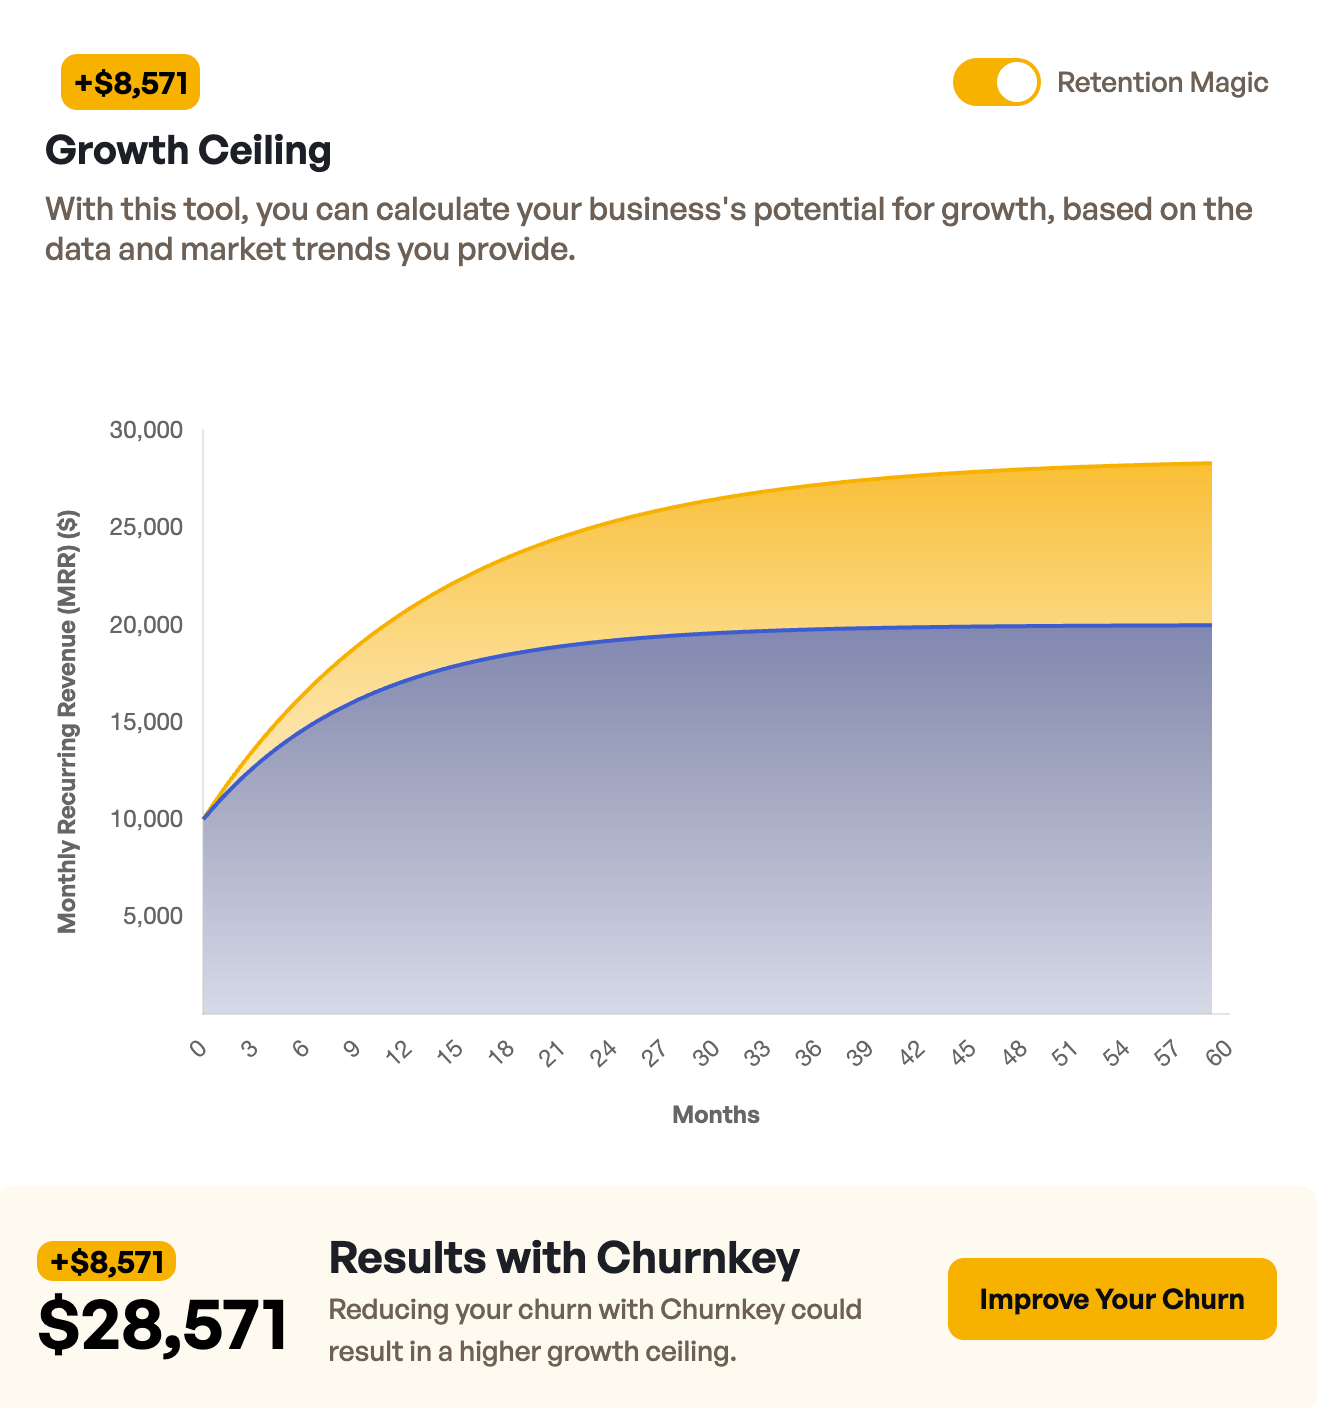
Pro Tip: Retention isn't just a reporting metric; it's your growth engine. Use our Growth Ceiling Calculator to see how your current retention rates will cap your total ARR. It’s a sobering realization that a small improvement in retention today could double your business’s potential.
Optimizing your retention metrics shouldn’t be a manual chore. You need a system that acts at the moment of peak churn risk. Churnkey’s Cancel Flows intercept cancellations with personalized offers, subscription pauses, and feedback loops that save up to 60% of departing customers.
Final Words: Retention Metrics Action Plan
If you're not tracking gross, net, or logo retention yet, start with logo retention, because it's the simplest to calculate and the most fundamental indicator of whether you've built something people want to keep using.
If you're only tracking one metric, add gross revenue retention next. The combination will reveal whether revenue loss or customer loss is your bigger problem, and you can't fix what you can't see.
If you're already tracking all three, review the relationship between them monthly and look for divergence patterns that signal specific problems, like NRR masking GRR issues or logo retention hiding revenue contraction.


