What are the Normal and Good Churn Rates for SaaS?
Experienced SaaS founders try to answer an age-old question. Is my churn rate high?
As a SaaS founder, you face churn every day. It stunts your business’ growth, decides your revenue ceiling, and can determine your state of mind.
Although customer cancellations are inevitable, the good news is that combating churn is largely about mindset. It’s a problem that can be solved.
Key Takeaways:
- If your B2B SaaS churn is ~3% monthly or less, you’re doing relatively well, and under 1% monthly is excellent.
- A well-performing B2C SaaS can decrease the average monthly churn to ~4–5%.
- If you serve prosumers, you’ll likely want to aim for maybe ~3–5% monthly churn as a good target.
How to Evaluate a Good Churn Rate for SaaS?
A good churn rate in SaaS is a highly relative metric and can vary depending on your target market and business model. For a small-business-focused SaaS, a good churn rate is around 3–5% per month. However, the same 3–5% per month churn for SaaS companies selling to larger enterprises can have big negative consequences, because they need much lower churn. Don’t be surprised; often it's a single digit per year.
When your main customer base is large and more enterprise-focused, even if you lose one of them, the effects on the business can be significant. For SMB or B2C SaaS, normal churn rates will be higher, but it doesn’t mean you need to sit with your arms crossed.
I want to remind you that any churn means lost revenue that needs replacing. So good churn is also relative when you compare it to your growth rate. Even a 2% monthly churn could be problematic if you’re not adding at least that many new customers in the same period.
💬 “Don’t chase a mythical ‘good churn’ number; define your churn band for your product and segment and work down from there.” — Baird Hall, Churnkey’s cofounder, 4x SaaS founder.
How to Calculate SaaS Churn Rate
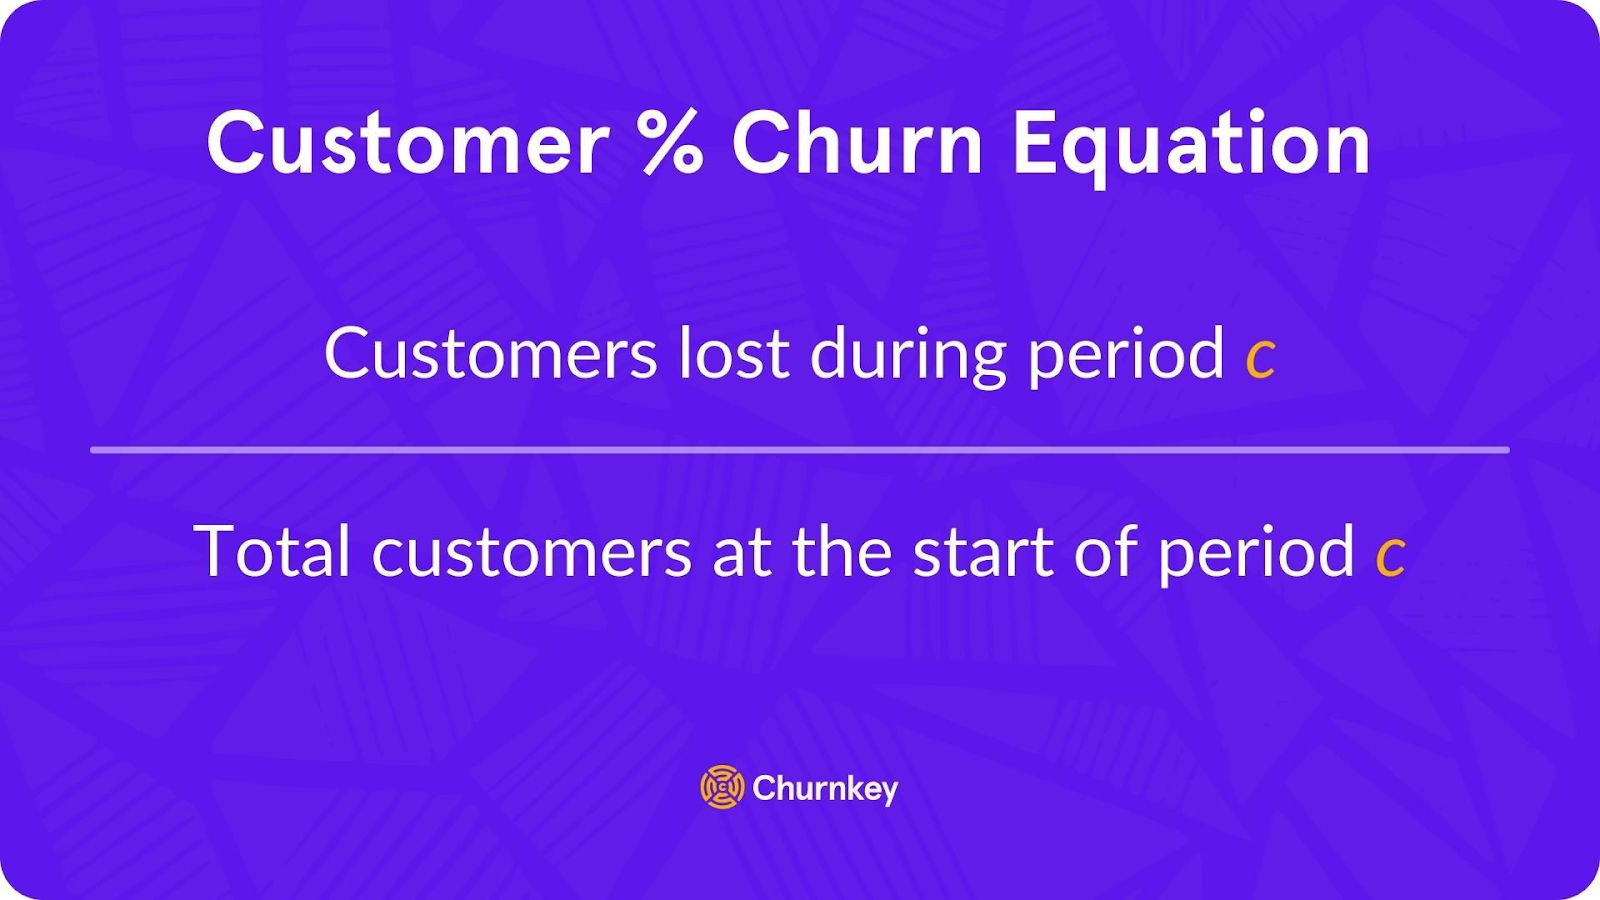
Churn rate is the percentage of customers lost over a given time period. Here is the formula to calculate it (or you can use our free churn rate calculator):
Churn Rate = Lost Customers in X Period/Total Customers at Start of Period×100
Now let’s see an example:
- You had 1,000 customers at the start of the month.
- 50 of them canceled by the end of the month.
Your monthly churn rate would be (50/1000) × 100 = 5%. It means if 5% churn per month continues, that would translate to around 46% annual churn because of the compounding effects (losing nearly half your customer base over a year).
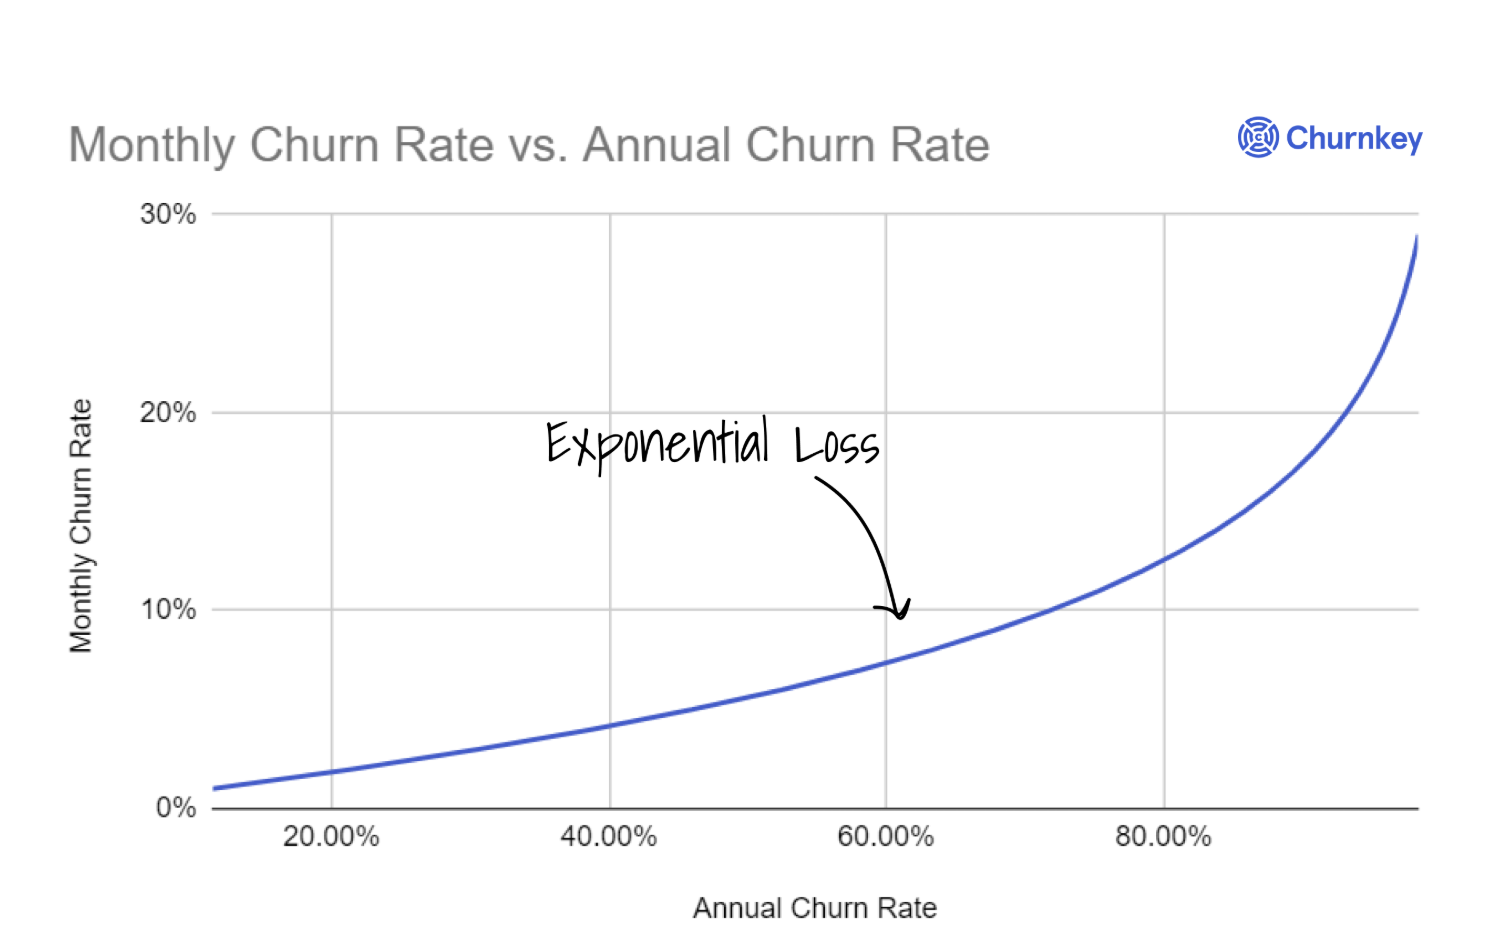
That’s why it’s critical to calculate monthly and annual churn rates separately and then compare them. At first glance, a small monthly churn can snowball into a very large annual loss.
During our calls with Churnkey’s first-time clients, we see that many SaaS businesses track churn monthly and don’t calculate the annual churn rate for a bigger picture. If you decide to calculate the annual churn, you need to use the following formula:
Annual Churn =1−(1−Monthly Churn)^12
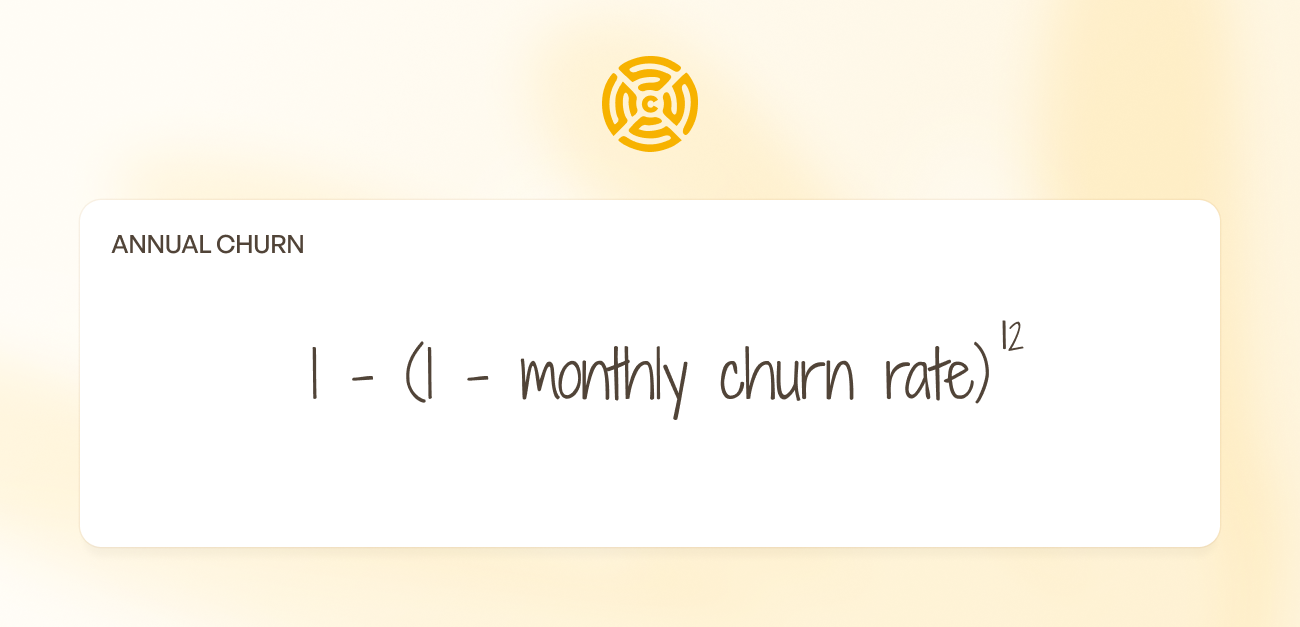
Now, using the above example, let’s calculate the annual churn:
Annual Churn =1−(1−0.05)^12
So, now you can see why a small 5% monthly churn leads to about 46% annual churn.
I would advise calculating both customer churn and revenue churn and comparing the results. Customer churn counts how many subscribers cancel, whereas revenue churn accounts for how much ARR/MRR is lost.
💬Tip: You can use Churnkey’s SaaS Valuation Calculator to see how churn, growth, and profit affect your SaaS valuation.
Normal Churn Rates for B2B SaaS Companies
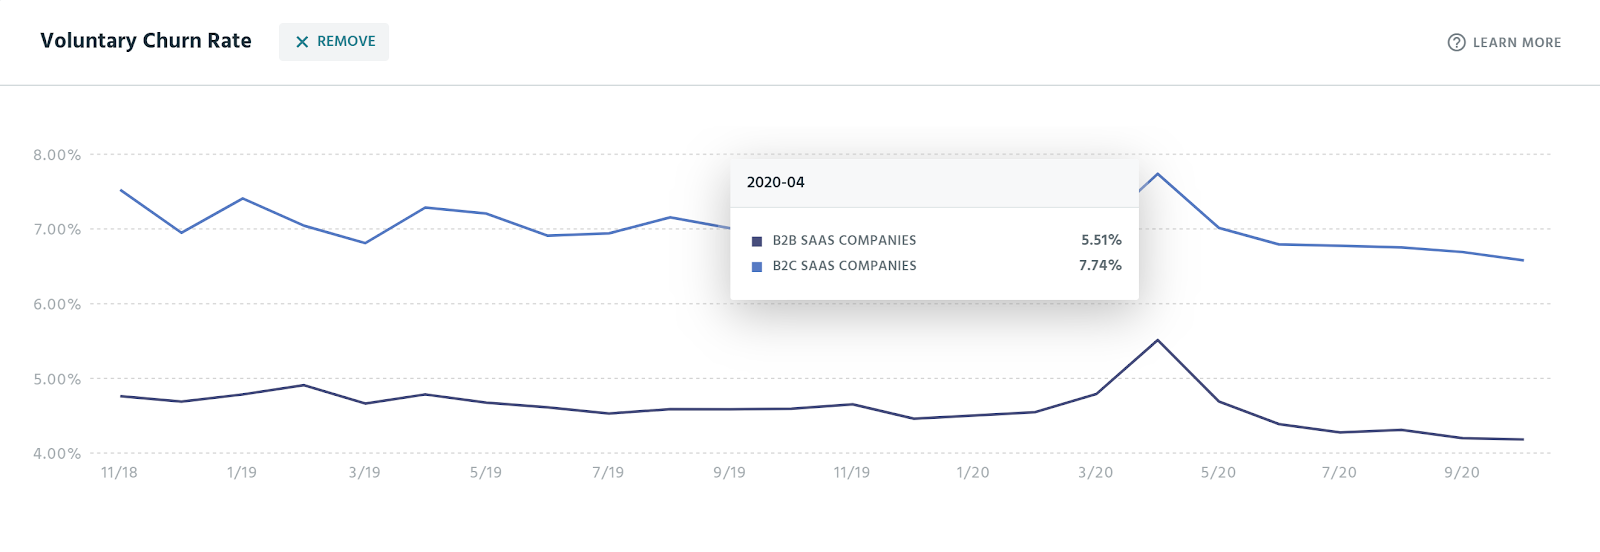
B2B SaaS churn rate averages around 3–5% per month. B2B SaaS companies usually have lower churn compared to B2C SaaS businesses. In my practice, enterprise-focused SaaS often achieve even better retention. I have seen many large SaaS firms report average <10% churn annually.
This happens because enterprise customers tend to stick longer due to longer contracts, deeper integrations, longer decision-making processes, and higher switching costs. They are also much more likely to purchase contracts on an annual basis, which, as you guessed, comes with high renewal rates.
Normal Churn Rates for B2C SaaS Companies
Consumer-facing SaaS normal churn often falls in the 6–8% per month range. The reason is that consumers have less loyalty to any single app, higher price sensitivity, and usually no contractual commitment to stick around. They are also more likely to make impulsive purchases.
For many of our B2C clients at Churnkey, we see the same pattern: a normal churn of around 6–8% monthly. But it’s certainly a metric you’d want to improve if possible.
A well-performing consumer SaaS can reduce average monthly churn to ~4–5%. For example, VEED (B2C/B2B video editing SaaS) took a proactive approach to optimizing their retention strategy. By implementing ethical cancellation flows with Churnkey's Cancel Flow and Adaptive Offers, they successfully reduced churn while simultaneously recovering 14,000 failed payments through Churnkey's Payment Recovery feature, demonstrating how addressing both voluntary and involuntary churn can compound retention improvements.
Normal Churn Rates for Prosumer Companies
Many SaaS companies don’t fall into the typical B2C or B2B buckets. A lot of software targets niche professionals or hobbyists, who are often called the prosumer segment or professional consumers.
Prosumers are individuals who pay for tools to produce content or perform work. Podcasters, video creators, photographers, influencers, and bloggers are all great examples of prosumers.
As expected, prosumers have a blend of attributes between B2B- and B2C-focused companies and generally have a churn rate between the two. For instance, a prosumer SaaS might have ~5% monthly churn as a normal benchmark; it’s higher than an enterprise B2B tool, but lower than a mass-market consumer app.
I would say that the opportunities to lower churn rate for this segment are very tangible, because the client base is serious and loyal users who heavily rely on the tool.
How to Calculate Revenue Churn Rates for SaaS Companies
Revenue churn measures how much recurring revenue you lose in a given period because of cancellations, payment failures, downgrades, etc. The formula for gross revenue churn rate is:
Gross Revenue Churn Rate = MRR Lost in a Period/MRR at the Beginning of the Period
Multiply the result by 100, and you have your rate in %
Let’s say you start the month with $250,000 monthly recurring revenue. During the month, you lose $15,000 from cancellations and downgrades; your gross revenue churn would be:
$15,000÷$250,000x100=6%
If you want to calculate net revenue churn, simply add the expansion line:
Net Revenue Churn Rate = (MRR Lost in a Period - Expansion MRR) /MRR at the Beginning of the Period
Now, multiply it by 100, and you have your rate in %.
If you start the month with $250,000 in monthly recurring revenue, lose $15,000 from cancellations and downgrades, and gain $11,000 from expansions, your net revenue churn would be:
($15,000−$11,000)÷$250,000x100=1.6%
A “good” revenue churn rate is relative. As you analyze your numbers, always compare revenue churn against your segment, pricing model, and acquisition costs. For healthy SaaS companies, especially in B2B, the gross revenue churn rate should be in the low single digits per month, and the net revenue churn rate should be at or below zero. This means you’re in a net negative churn range because of expansions and upsells.
SaaS Churn Benchmarks by Industry
Churn rates vary not only by whether you’re in B2B or B2C, but also by the industry or vertical your product is in. Some industries naturally have stickier products than others. So, knowing your industry’s average churn benchmarks data can give you some data for deeper churn analysis.
Subscription products in media/entertainment, e-commerce subscription boxes, consumer retail, and education tend to have higher churn. On the other hand, B2B software and services have lower churn.
I want to highlight that highly precise, public, non-competitor datasets with exact monthly churn by vertical aren’t widely available beyond segments like B2B SaaS and SVOD. I would be cautious with churn data from unreliable sources and would base analysis on reputable benchmarks.
To learn more, read our latest research articles:
Factors That Determine SaaS Churn Rate
By far, pricing is the most important factor when determining a SaaS’s churn rate. It’s the backbone of the difference between B2B and B2C SaaS companies' churn.
I also listed other factors that may affect the churn rate based on the niche, product type, target audience, etc.
Company Size and Stage
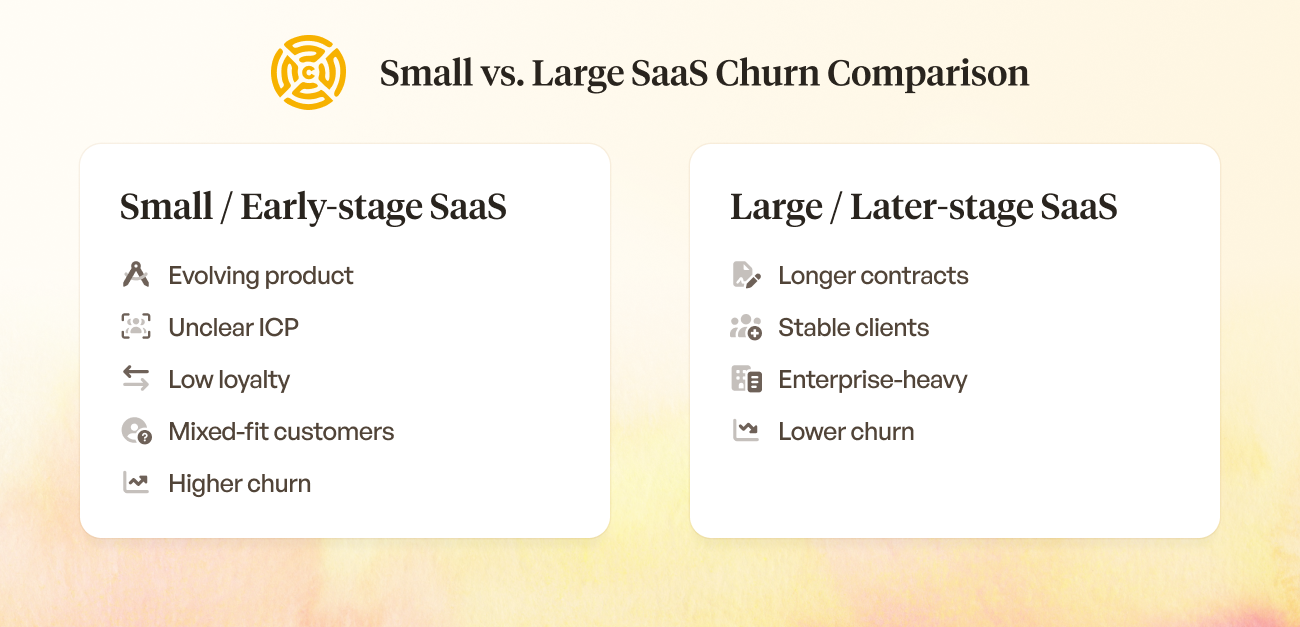
Your churn rate will look very different depending on your company’s size. In the early stages, your product, positioning, and ideal customer profile are still evolving. At this point, you don’t yet have a loyal customer base, and you attract a wider variety of customers, including many who aren’t the best fit, so more of them will churn.
Later-stage and larger SaaS companies attract longer contracts, more stable clients, and a higher share of enterprise customers. That’s why comparing your early-stage churn to a bigger SaaS business’s “average churn rate” can be misleading.
Product Category: Is It a Must-Have or a Nice-to-Have?
Tools that are mission-critical (e.g., an accounting platform or an API that a product is built on) will be retained at higher rates. If your SaaS solves a pain point directly tied to revenue or core operations, customers are less likely to churn. But if it’s just a nice-to-have tool, customers may cancel it when budgets tighten or a new, cheaper alternative appears.
Bad User Experience
Poor user experience, bugs, or bad customer support can drive customers away. In my experience, onboarding is especially crucial: if users don’t successfully understand or adopt your product early, they are at high risk of churning. If their problems aren’t resolved quickly, they will start looking for an alternative.
Product Value and Engagement
SaaS products must continually deliver value. If customers aren’t using the product (low engagement) or not achieving the desired result they bought it for, they will not hesitate to cancel. You must regularly track how users interact with your tool to spot value gaps before they turn into churn.
Competition and Alternatives
In markets with many competing tools or easy substitutes, churn is higher. Customers will easily switch to another software if they find a better deal. If a competing business offers similar features with clearer value, customers have little reason to stay unless they are highly loyal to your product or brand.
Market and External Factors
Broader market and political conditions can influence churn. For example, during economic downturns, big geopolitical changes, or budget cuts, businesses and even consumers may cut software expenses. During these periods, even satisfied and loyal customers may cancel or downgrade purely because of uncertainty and cost-cutting.
Involuntary churn
Finally, not all churn is intentional. Involuntary churn (failed payments, expired credit cards) can account for 20–40% of total churn in some B2C or even B2B contexts. You must analyze how you handle credit card expirations, retry billing, and dunning communications.
My main point here is: churn isn’t just a number, it’s an outcome of different areas of operations of your business. You must first understand where you are failing and check if it is the reason for your high churn rate.
FAQ
What is a Bad Churn Rate for SaaS Companies?
Generally, anything above the typical range for your sector is concerning. So a churn that’s higher than normal for your stage/industry/market is a bad churn, indicating customers are not finding sustained value in your product.
How to Determine How Low Churn Will Affect Your SaaS Revenue?
Calculate your revenue retention with different churn rates. For example, calculate your customer lifetime value (LTV) at your current churn vs. a reduced churn. This way, you’ll see that even a small decrease in churn can add substantial revenue.
How to Reduce SaaS Churn Rate?
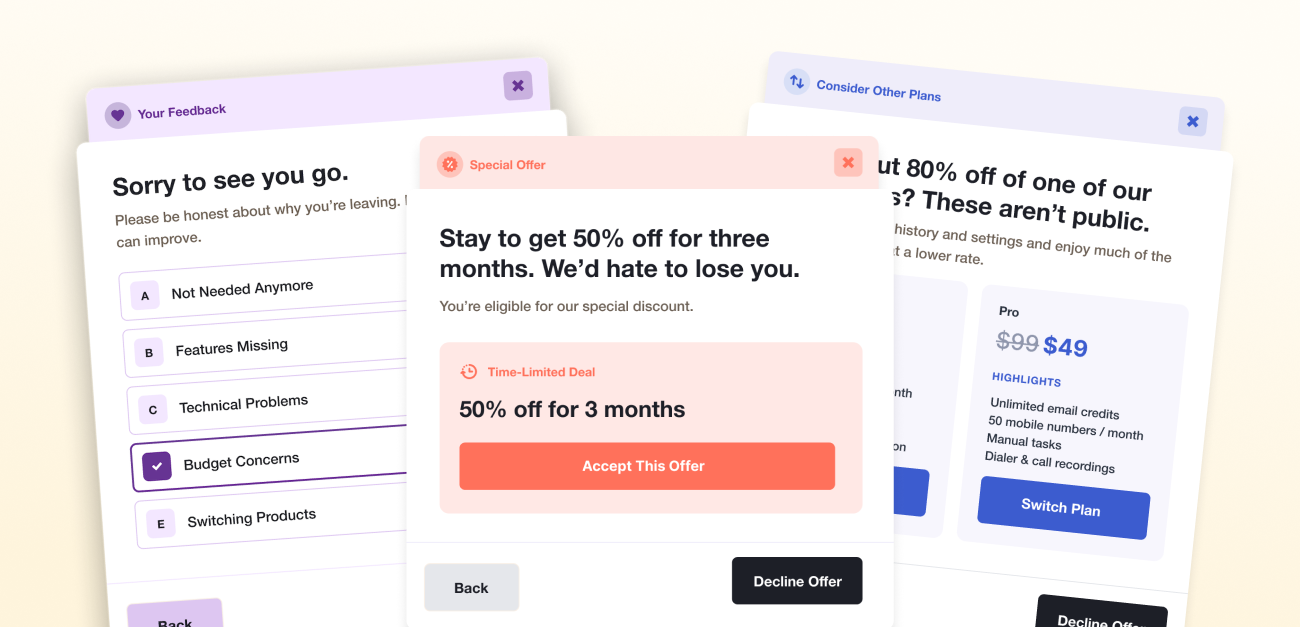
Reducing churn requires an ongoing, customer-centric approach across the entire lifecycle. First, focus on onboarding and activation, engage and support your customers consistently, offer flexibility to at-risk customers, create a solid pricing strategy, implement a thoughtful cancellation flow (customer offboarding), analyze involuntary churn, and increase customer value and remove reasons to leave.
Conclusion
In the end, there’s no universal good churn rate; only what makes sense for your segment, pricing model, and stage of growth. What matters most is understanding where your churn comes from, tracking both customer and revenue churn over time, and putting strong systems in place to keep more of the right customers for longer.
If you want a retention platform that helps you do exactly that, with cancel flows, payment recovery, and churn insights working together instead of in silos, Churnkey can help you get there: Get a Demo.


