Launch: Fresh Dashboard With Powerful New Metrics
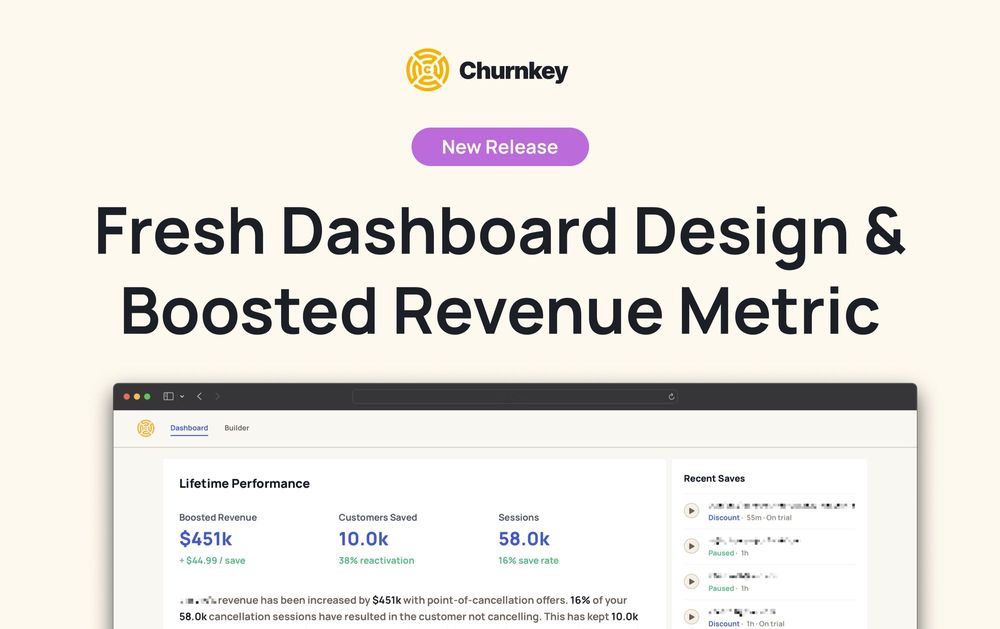
Today, we’re officially launching Churnkey’s new dashboard and introducing a new metric: Boosted Revenue.
Since our start, Churnkey has been focused on helping your business grow larger. That meant finding the most efficient ways for you and your customers to come to more beneficial arrangements. A different plan? Temporary discount? Pause for the summer?
Because of your support and the quality of our cancel experiences, Churnkey continues to grow. But over the past year, we’ve heard a similar question from a large number of our customers: just how effective, in revenue, are my offers?
So today we’re officially launching Churnkey’s new dashboard and introducing a new metric: Boosted Revenue.
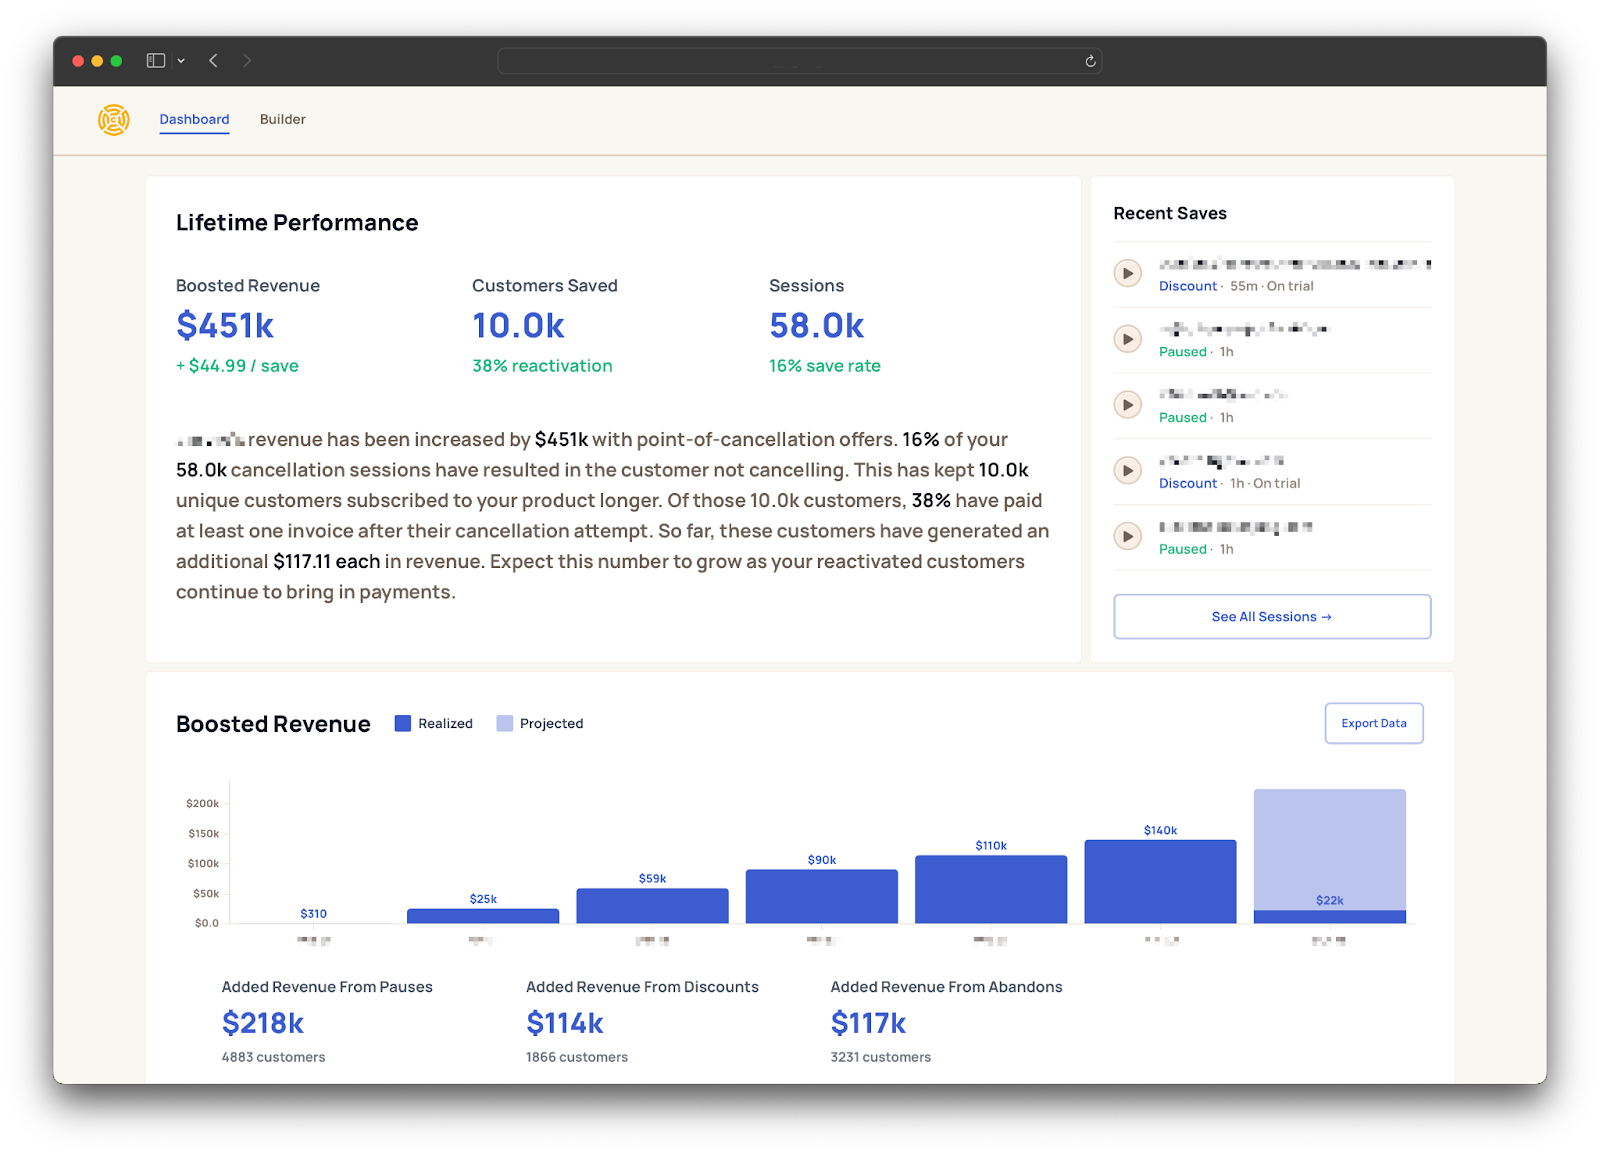
Boosted Revenue is a powerful metric that calculates revenue received from customers who would have otherwise cancelled.
To calculate Boosted Revenue, we started analyzing not only every customer profile, but every invoice that comes through your company’s payment processor. That means you can now see:
- The amount your revenue has been, and probably will be, increased because of your cancel flows
- Which customer segments perform the best
- Which offers best improve long-term revenue and retention
- How much ARPU is boosted over time
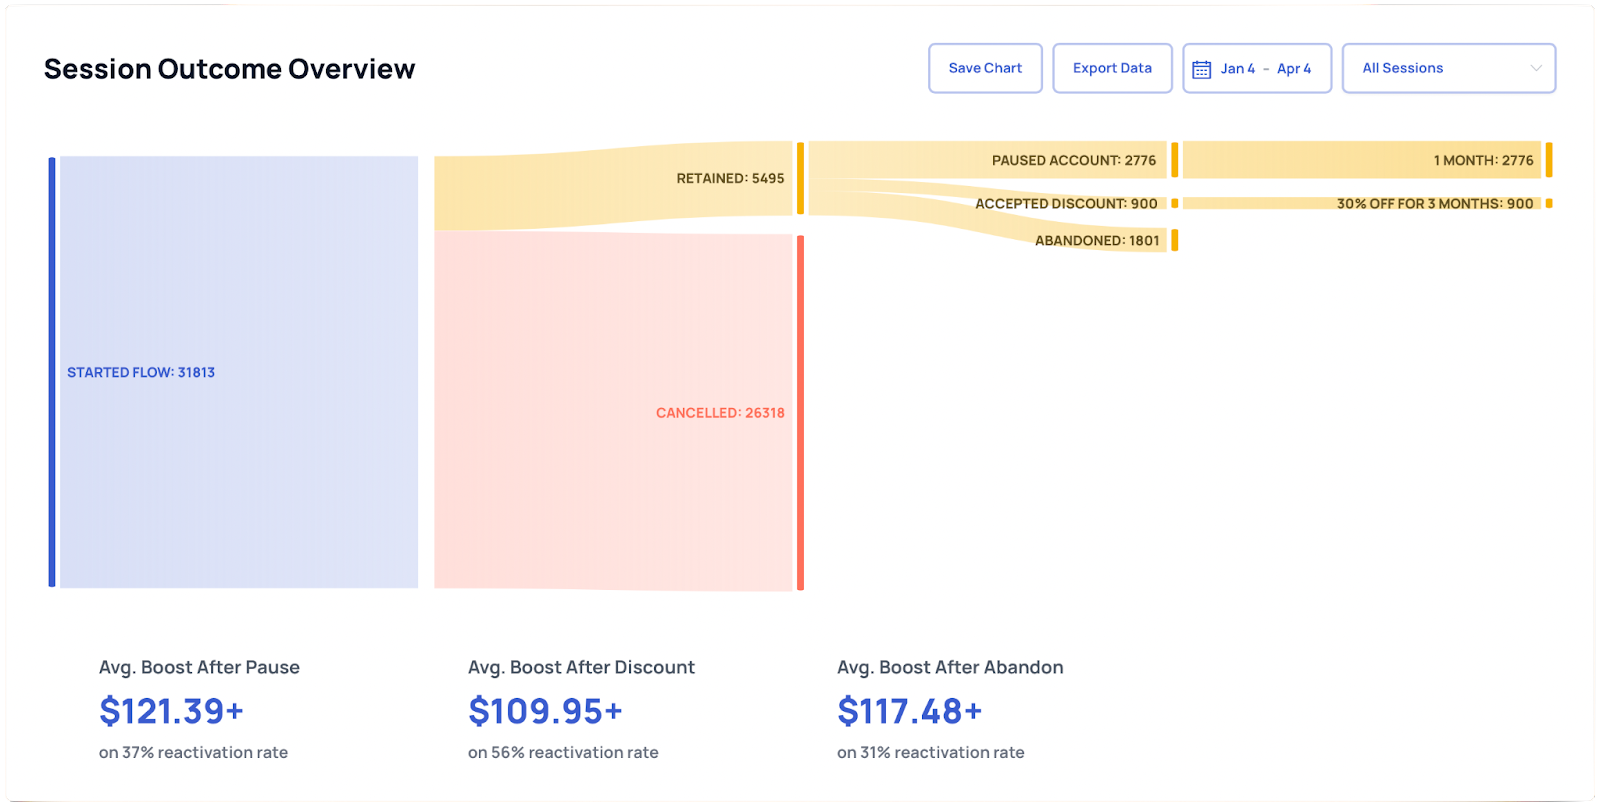
Beyond that, you can see which types of offers perform better than others in terms that you can directly apply to your business. And for the first time, you can see the power of abandoned sessions. Sometimes, just by having a cancel flow, customers will decide to stay subscribed for longer.
Because we’re dedicated to making data more accessible and convenient for you and your team, we’re also introducing core metrics like churn rate, ARPU, MRR, subscription status, and more, all within the same dashboard.
This includes a completely new design. We took your feedback and focused on data legibility. Your new dashboard is a brighter, more engaging, and more useful experience.

That includes new search capabilities that span across all cancel flow sessions and qualitative customer feedback. This makes it easier for you and your team to uncover keywords or trends to improve reactivation campaigns and product strategy.
Finally, you can save any chart and export any data you see to CSV. Enjoy better load times all around.
We’re really excited to get this into your hands. There’s a lot more to come!

