Unit Economics in SaaS: Metrics, Levers, and Growth
Unit economics determines whether acquiring a new SaaS customer builds enterprise value or destroys it. This guide breaks down the metrics, the levers, and the growth stage where each one has the highest impact on your LTV:CAC ratio.

Unit economics in SaaS answers one question: does acquiring a customer make you money, or cost you money across their entire lifetime with your product, not just in month one? The standard benchmark is a 3:1 LTV:CAC ratio, meaning every dollar spent acquiring a customer should return at least three dollars in gross-margin-adjusted lifetime value. But hitting 3:1 is the starting line, not the finish.
In this guide, I break down every metric that makes up your unit economics, the levers that move them, and exactly which one to focus on at your current stage of growth.
Key Highlights:
- A healthy LTV:CAC ratio of 3:1 or above confirms that your SaaS business generates more value from each customer than it spends to acquire them, but the ratio alone doesn't tell you which lever (CAC, Gross Revenue Retention, or gross margin) to pull to improve it at your current stage.
- Broken unit economics don't show up in revenue growth. They hide inside compound metrics like blended CAC and company-wide GRR, which is why a SaaS company can double ARR year-over-year while quietly accumulating unit economics debt that only surfaces at the Series B.
- Net Revenue Retention is the most powerful unit economics lever available to a scaled SaaS company because NRR above 100% increases CLTV, improves the LTV:CAC ratio, and grows the revenue base simultaneously, without acquiring a single new customer.
What Is Unit Economics in SaaS?
Unit economics in SaaS is figuring out how much money you make or lose every time you sign up a new customer. The "unit" is the customer, not the product: unlike a company selling $40 physical widgets, where cost and revenue reset with every transaction, a SaaS customer's value accumulates month after month, renewal after renewal, for as long as they stay. The cost of serving customer number 500 is nearly identical to serving customer number 1.
SaaS teams must monitor broken unit economics because they don't announce themselves. For example, a company doubling ARR year-over-year at a 1.5:1 LTV:CAC ratio isn't building a business, it's borrowing against one. Let's call it unit economics debt: the compounding liability that accumulates every quarter you scale before fixing the underlying math.
SaaS makes this harder to detect than almost any other business model. There's no physical cost of goods sold to put a floor on your margin. Customer value doesn't land at the point of sale; it accrues slowly ond over 12 to 36 months of renewals, and early churn wipes it out entirely before you've recouped CAC.
Key advice: If your unit economics are broken, scaling makes things worse. Every new customer you acquire accelerates the loss, not the recovery.
The 5 Core SaaS Unit Economics Metrics (And How They Connect)
The metrics below aren't separate numbers to track; they're one equation, and a change in any one of them ripples through the rest.
1. Average Revenue Per Account (ARPA)
Average Revenue Per Account (ARPA) is the amount each customer pays for your product. For instance, if you have 100 customers and a total of $100k in ARR, then your ARPA is $1,000. ARPA is the first input in the CLTV formula, which means any error in how you calculate it flows into your lifetime value figure, your LTV: CAC ratio, and the growth projections you're presenting to investors. The most common mistake is calculating a single blended ARPA across all active accounts instead of tracking ARPA by acquisition cohort.
2. Gross Margin
Gross margin is the percentage of revenue left after subtracting Cost of Goods Sold (COGS), calculated as:
Gross Margin = (Revenue – COGS) ÷ Revenue
If your SaaS product generates $500,000 in monthly revenue and carries $100,000 in COGS, your gross margin is 80%.
Healthy SaaS gross margins run between 70% and 80%; a gross margin below 65% signals that the cost structure is too heavy to support the sales and marketing investment needed to scale, and companies in that range require approximately 40% more capital to reach profitability than those operating above 80%, according to KeyBanc Capital Markets' SaaS Survey.
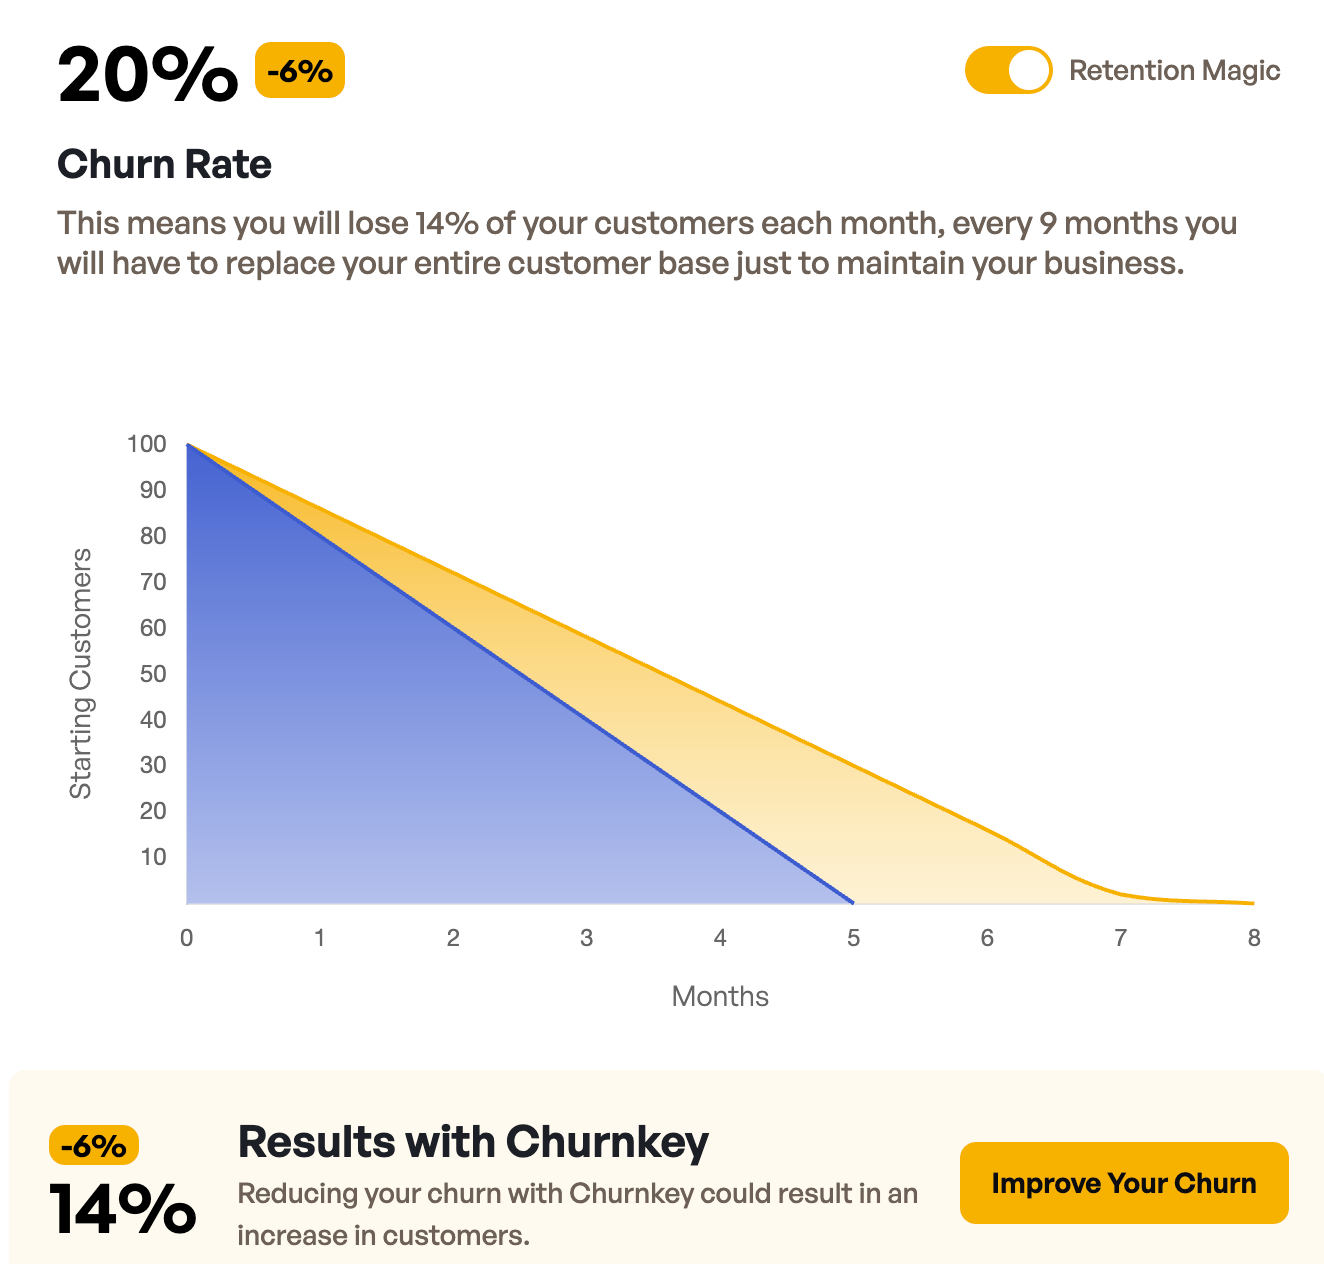
3. Gross Revenue Retention (GRR)
Your GRR is the rate at which you retain a cohort of customer revenue over a given period of time, typically a quarter or a year. It is calculated as:
GRR = (MRR at the start of the month - Churn - Contractions) / MRR at the start of the month

A GRR of 90% or above is considered world-class for B2B SaaS; a GRR below 80% puts the business in structural danger, because at that annual churn rate, a company losing 20% of its recurring revenue base annually needs to replace one-fifth of its entire ARR before it can grow by a single dollar.
💡 Learn how to calculate the annual churn rate or use our free churn rate calculator.
4. Customer Acquisition Cost (CAC) and CAC Payback Period
Customer Acquisition Cost (CAC) is the full cost of winning one new customer, calculated as:
CAC = (Total Sales Costs + Marketing Costs) / New Customers Acquired
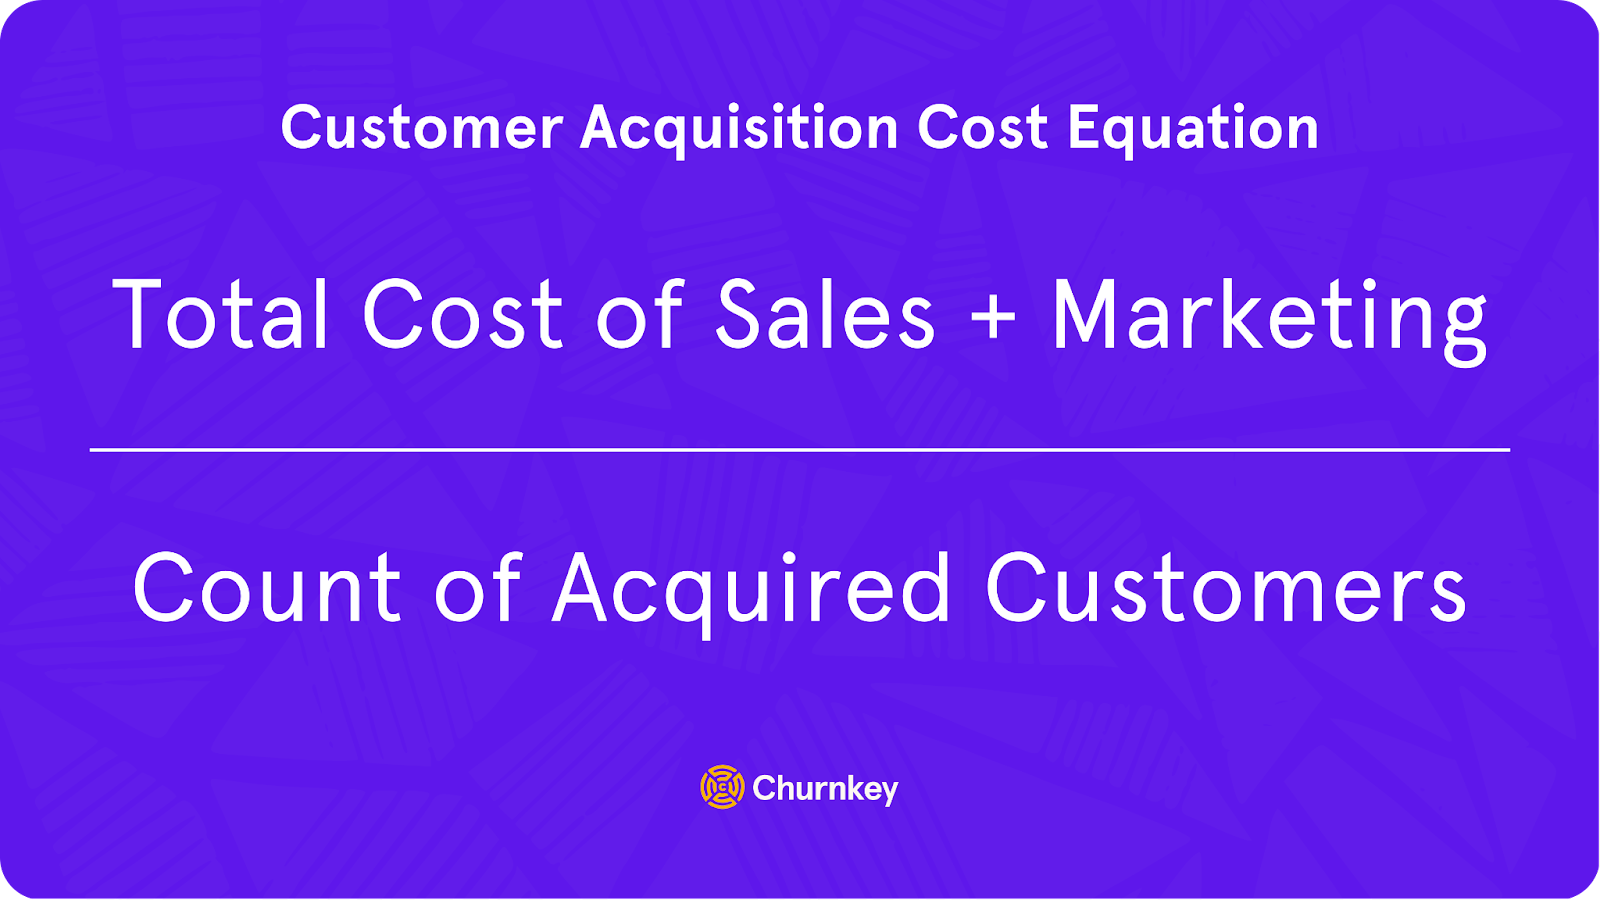
SaaS companies that exclude salaries and tools from their CAC calculation underestimate their true acquisition cost by 30–50%, according to Redpoint Ventures partner Tomasz Tunguz. This means a company reporting a $1,200 CAC may be operating at a real CAC closer to $1,800, and every LTV:CAC ratio built on the $1,200 figure is structurally overstated.
CAC Payback Period measures the number of months required to recover CAC through gross profit alone, calculated as:
CAC Payback Period = CAC ÷ (ARPA × Gross Margin)
A SaaS company with a $1,800 CAC, $500 monthly ARPA, and 75% gross margin has a CAC Payback Period of 4.8 months, while the same company at 60% gross margin extends that payback to 6 months before a single dollar of net profit is generated.
A CAC Payback Period under 12 months is considered strong for B2B SaaS; anything above 18 months requires immediate intervention, not because the LTV:CAC ratio is necessarily broken, but because a 24-month payback period on a 36-month average customer lifetime leaves a company with less than 12 months of gross-margin-positive tenure per customer. If churn accelerates by even 5 percentage points during that window, the ratio turns negative before payback is reached.
5. Customer Lifetime Value (CLTV) and the CLTV:CAC Ratio
CLTV/CAC is a ratio that measures the relationship between a customer's lifetime value and the cost of acquiring them. The formula is simple:
CLTV/CAC Ratio = CLTV/CAC
The formula for CLTV is as follows:
CLTV = (ARPA * Gross Margin) / (1 - Gross Retention Rate)
CLTV is calculated on the gross profit generated by customers. To get gross profit per customer, you’ll multiply Average Revenue Per Account (ARPA) by gross margin.
If you think about selling a physical good rather than software, gross profit is easier to understand. For instance, if you buy widgets wholesale for $1 and sell them to customers for $5, gross profit is $4 and gross margin is 80%.
Once you have gross profit, you divide it by gross churn rate to get lifetime value. You’ll often see churn rate expressed as [1 - Gross Retention Rate], the inverse of gross retention. Assuming a gross retention rate is 85%, you would divide by (1-.85), or .15.
For example, if ARPA is $1000, gross margin is 75%, and gross churn rate is 15%: CLTV = (1000 * 75%) / (1 - .85)CLTV = 750 / .15CLTV = $5,000. The annual gross profit per account is $750. When we divide it by the churn rate, the average gross margin-adjusted lifetime value is $5,000. This can also be expressed in terms of time by dividing $5,000 by the $750 annual gross profit per customer, giving us an average tenure of 6.7 years.
CAC is the total of all sales and marketing expenses you incur to win new business during a given period. Often, CFOs will also allocate a portion of customer success team expenses to CAC based on the percentage of their time spent generating sales.
For example, if you spend $1 million on Sales and Marketing to acquire 1000 new accounts during a period, your CAC would be $1,000 per customer ($1,000,000 / 1,000 = $1,000).
In our hypothetical examples above, the lifetime gross profit of a customer is five times the cost to acquire it. The math is simple:
CLTV = $5,000
CAC = $1,000
CLTV/CAC Ratio = $5,000 / $1,000
CLTV/CAC Ratio = 5
In SaaS, this ratio should ideally be 3:1 or higher.
The Metric That Changes Everything: Net Revenue Retention
Net revenue retention measures the percentage of recurring revenue retained from an existing customer base over 12 months. It is calculated as:NRR = (MRR at the end of the month + Expansion MRR - Churn MRR) / MRR at the start of the month * 100.
Unlike GRR, NRR can exceed 100%, which means a SaaS company's existing customer base generates more revenue at the end of the measurement period than it did at the start, with zero new customer acquisition required to produce that growth.
When NRR is above 100%, compounds CLTV faster than any reduction in CAC or increase in ARPA can achieve independently, SaaS companies with net negative churn command valuation premiums that seem disconnected from their current ARR.
The most direct path to NRR above 100% runs through gross churn reduction, not expansion alone: every percentage point reduction in gross monthly churn lowers the gross churn rate in the CLTV denominator, which increases CLTV, improves the LTV:CAC ratio, and raises NRR simultaneously. This makes churn reduction the single unit economics lever that improves all metrics at once without requiring a pricing change, a headcount addition, or a new acquisition channel.
Unit Economics in Practice: CAC, GRR, and Margin by Growth Stage
Unit economics has three levers: CAC, Gross Revenue Retention, and gross margin. Each one moves your LTV:CAC ratio, but not equally, and not at every stage. The table below maps each lever to the ARR stage where it produces the highest return on effort, based on which compounding dynamic dominates that phase of growth.
How to Improve Unit Economics
SaaS operators can impact unit economics by focusing on the atomic components of the CLTV/CAC: increasing ARPA, reducing COGS, and increasing gross retention.
You can improve gross margin by raising prices while keeping the cost of goods sold constant. You can also improve it by maintaining price points while increasing delivery efficiency. To do that, you can try using some of the strategies and tactics below:
- Optimizing cloud hosting costs.
- Using AI to increase support efficiency and reduce headcount.
- Reducing the number of professional services headcount required to onboard new customers.
- Increasing the amount of ARR assigned to each customer success manager. Each of these examples results in lower COGS
Reducing customer churn has the obvious impact of increasing gross retention, which impacts lifetime value. Improving retention by just one percentage point, from 85% to 86%, adds five months to the average lifetime of a customer. That’s a 6%+ improvement.
You can also improve unit economics by reducing CAC relative to each new dollar of new ARR/MRR you bring in. Some tactics you could use to accomplish this are:
- Generating high-intent, inbound leads.
- Spreading sales targets across fewer, stronger account executives.
- Eliminating go-to-market programs that aren't working (e.g., SDR teams, event sponsorships, etc.)
- Scrutinizing paid media, lead generation, and search placement programs.
Unit Economics Mistakes SaaS Companies Make (And How to Fix Them)
Most unit economics errors compound inside the metrics themselves, producing numbers that look healthy until a growth stall or a failed fundraise forces a closer look. The five mistakes below are the ones that show up most consistently in SaaS businesses:
- Calculating blended CAC instead of channel-level CAC.
- Using revenue-based LTV instead of gross-margin-adjusted LTV.
- Ignoring cohort-level GRR deterioration.
- Treating LTV:CAC as a fundraising metric rather than an operating metric.
- Optimising LTV:CAC ratio while ignoring CAC Payback Period.
How Churn Reduction Improves Your Unit Economics
Every improvement in gross retention flows into three unit economics metrics in sequence:
- Lower monthly churn reduces gross churn rate.
- A lower gross churn rate increases CLTV.
- A higher CLTV improves the LTV:CAC ratio without touching acquisition spend, pricing, or headcount.
- A meaningful reduction in monthly gross churn produces a significant CLTV increase and pushes the LTV:CAC ratio well above the 3:1 investor threshold from a single operational change, with no new budget required.
Gross churn in SaaS splits into two distinct categories that require different interventions.
- Voluntary churn, where a customer decides to cancel, is addressable through a cancel flow tool, which includes pause options, plan downgrades, and discount offers.

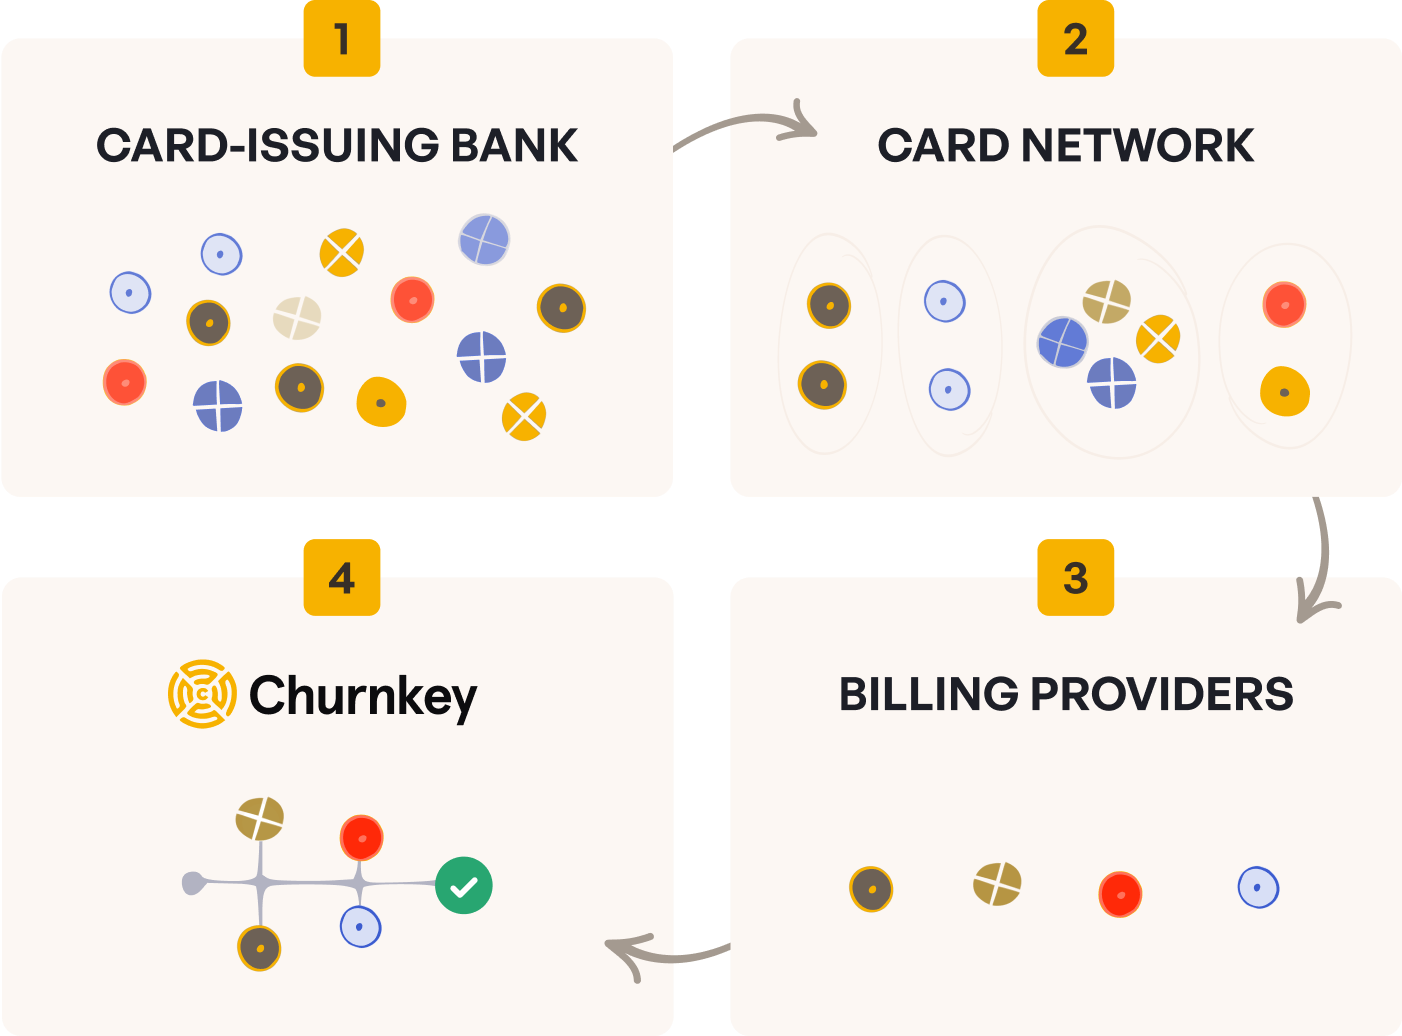
- Involuntary churn, where a subscription lapses because a payment method fails due to card expiry, insufficient funds, or bank-side declines, is addressable through dunning management and payment retries.
Conclusion: Unit Economics Is a Compass, Not a Scoreboard
Unit economics doesn't tell you how big your business is; it tells you whether growing bigger makes it stronger or weaker. A SaaS company that tracks LTV:CAC, GRR, NRR, gross margin, and CAC Payback Period as a monthly operating discipline knows, in real time, whether each new customer acquired is building enterprise value or consuming capital that will never be returned.
The most useful thing you can do after reading this is identify which of the three levers sits furthest below its benchmark at your current ARR stage, and focus on moving that single number.
If you want us on your team, we’re ready to help. Churnkey's suite of churn reduction solutions, including dunning management, cancel flows, and reactivation strategies, is tailored to fortify unit economics for SaaS companies.