Customer Retention Curve: Calculator, Definition, Examples
There are four types of retention curves: declining, flat, and smile curve. You measure active users (# or % or $) on the x axis. And how that number changes over time.

What Is A Retention Curve?
A retention curve shows how the number of active users changes over time. It answers the question, "How many people continue to use our product over time?"
You use retention curves to identify user behavior and measure the effectiveness of your retention strategies.
Types Of Retention Curves
There are four types of retention curves: declining, flat, and smile curve.
You measure active users (# or % or $) on the x axis. And how that number changes over time.
1. Trend to Zero Curve
Description: The retention curve slopes downward towards zero, indicating that over time, all users eventually stop using the product.

Example: Tinder/Hinge, where users stop using the app after finding a significant other.

2. Flat-ish Curve
Description: The retention curve has a slight downward slope but trends towards zero very slowly. With some engagement and optimization, it can be shifted to a flat curve.

Example: Products that need minor improvements to achieve better retention. If your monthly churn is ~5% which roughly translates to losing ~46% customers every year.
Solution: If your retention curve is declining, Churnkey can be the most effective fix. We tackle both voluntary and involuntary churn at its core. You can set up Failed Payments Recovery's Precision Retries in as little as 15-minutes. No engineers required since we integrate natively with Stripe, Chargebee, Padddle and the likes. The rest of Churnkey's suite includes Cancel Flows, Reactivations, Dunning, all of which you can layer on to maximize revenue retention.

It takes less than a few hours to set up all of Churnkey and saves 20-30% of the revenue that would have otherwise been lost to churn.
3. Flat Curve
The retention curve is flat, indicating that a certain percentage of users continue to use the product over time. This is the ideal retention curve as it provides a stable user base.

4. Smile Curve
Description: The retention curve initially decreases, then flattens, and eventually starts to increase again. This indicates that users who initially churned are returning to the product. Smile curves are a dream state for SaaS companies.

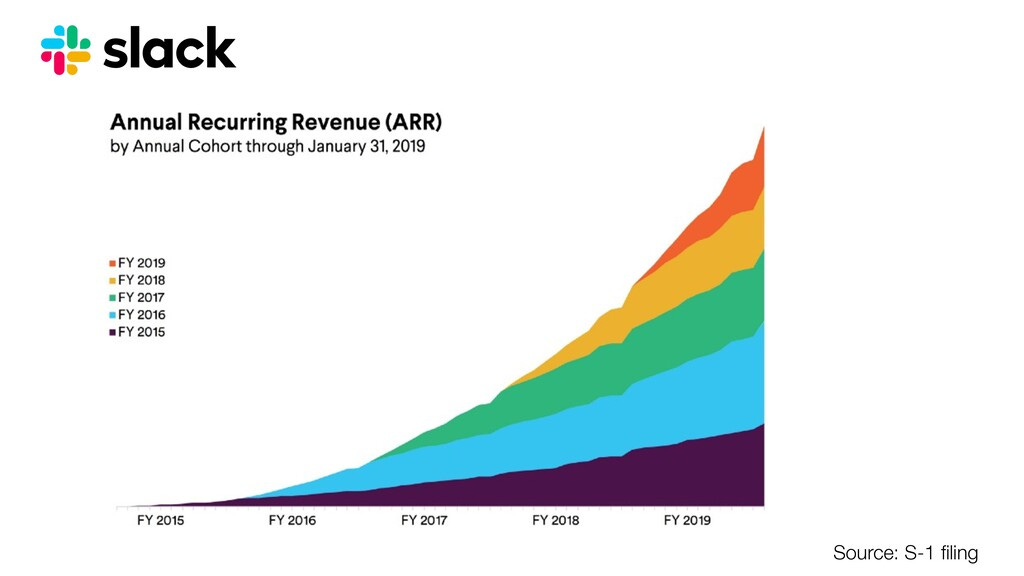
Example: Network effect companies like Airbnb and Slack, where the value of the product increases as the network grows.
Solution: You can achieve smile curves by expanding or reactivating users. For mature companies, 80-85% of your revenue would come from retaining customers, vs newly acquired customers. Churnkey's reactivation product might be an easy yet impactful add-on.
Visualize Your Retention Curves in 1-Click for Free
Get a free, visual analysis of your churn metrics and understand how your retention compares to other companies. With our free product, you can visualize:
- Gross and new churn rates by date.
- Involuntary and voluntary churn rates.
- Revenue vs logo churn.
- Retention cohort analysis.
- New vs. old churn.
- Churn cake charts.
Live Retention Curve Calculator
Enter users or revenue in the fields below and we'll visualize the chart for you. This is a simplistic model and only calculates for one cohort.
Analyzing Retention Curves
When analyzing the retention curve, you should start with these prompts:
- Analyze where does the drop occur? Does it happen in Month 2 or Month 6?
- Analyze if there are any shifts in different cohorts? Did your marketing strategy or product stability change? Were there any other macro-economic conditions or seasonality?
- Is the slope accelerating or decelerating?
- Are there any outliers in the cohort retention charts? If you look diagonally across the cohort retention chart, do you see a pattern?
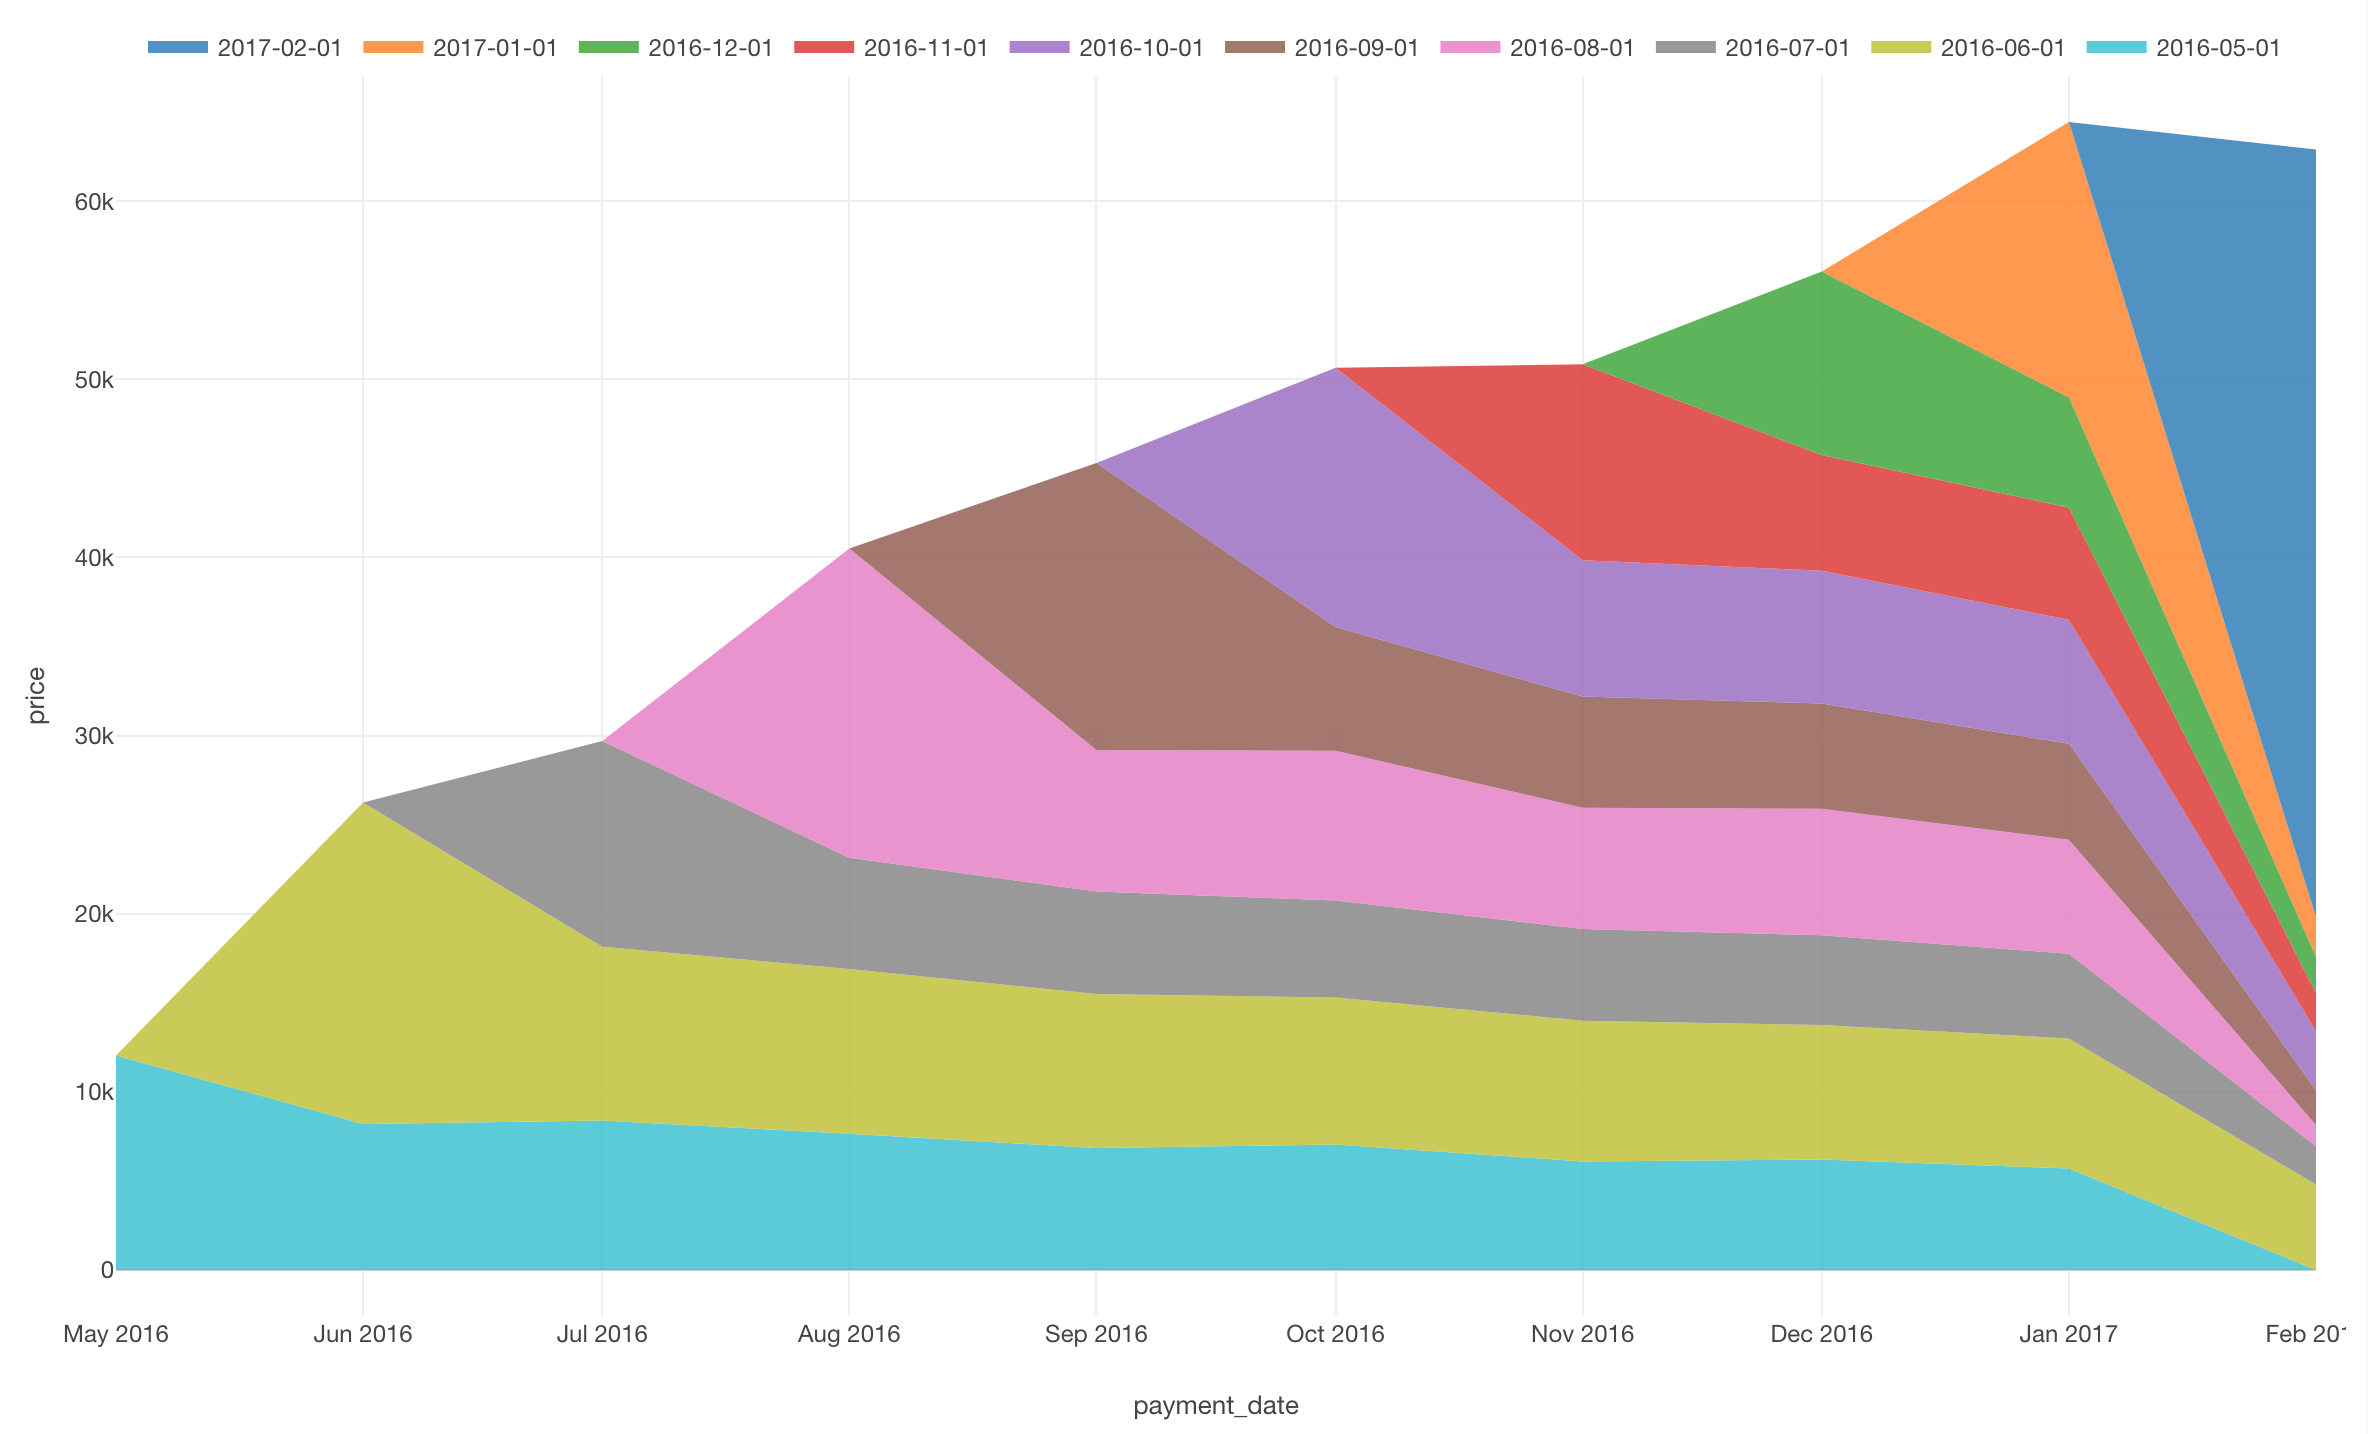
Cake Graph: A Variation Of Retention Curves
You can visualize customer retention in layers, similar to the layers of a cake, with each layer representing a different cohort or time period.
By stacking these layers, the graph shows how the retention of each cohort contributes to the overall growth of active users.
An Example Of Poor Net Dollar Retention
If the retention curves of individual cohorts trend towards zero, the overall growth will flatten and eventually decline (image source).
An Example Of High Net Dollar Retention
Conversely, if the retention curves are flat or improving, the cumulative growth will show a healthy upward trend. Some people also call it the 'rainbow chart'.
This is a real example from Slack. Each cohort expands over time and contributes to total revenue.
How To Create Retention Curves?
Creating a retention curve depends on the tools you already have access to and the resources you have in your team.
- If you're a data scientist, they might be able to create some graphs. I found a useful tutorial in Exploratory.
- Stripe or most billing providers offer simplistic retention cohorts out of the gate but these aren't retention curves, although can be a good start.
- For the PMs, growth professionals and marketers, you might be able to use Mixpanel or Amplitude. I recommend calculating your product's natural usage frequency if you have time to spare.
- If you're in Finance, you might feel more comfortable setting up spreadsheet with tools like Rows.com.
How To Optimize A Declining Retention Curve?
A declining retention curve is an opportunity. Slight improvements in your retention can make a huge difference to your growth ceiling.
1. Transition Use Cases
People used Zillow to buy or sell homes. You don't purchase homes all that often, maybe once a year. So, to offset that, Zillow launched a Zillow Zestimate to increase engagement.

2. Launch New Products
Bumble, the dating platform, launched Bumble for friends and Bumble for work.

3. Layer A Retention Automation Tool
Launching new products or pivoting to a different ICP are resource-intensive efforts. A quicker way to improve the slope of your retention curve is with a good retention automation software.

Churnkey can offer a strong feedback loop from both trialing customers and paid customers that you can then input back into your product strategy. It can also reduce voluntary and involuntary churn as and when it happens. You get a complete platform including cancel flows, precision retries, customer health scores, and Feedback AI.
4. Increase AOV From Power Users
Lego, the toy company has always had high natural churn. Children grow up and don't need toys anymore. So LEGO expanded their portfolio to include sets for adults. You might be able to impact net revenue retention by focusing on your power users.

5. Reduce Activation Friction
A template library, successfully adopted by Notion, Figma, and Miro, reduces activation friction and minimizes churn by helping users derive value from your product.

Growthmates and ProductLedGrowers offer valuable insights on how to reduce activation friction.
Want to learn more about retention curves?
Elena Verna specializes in B2B Product-led growth & sales. She's led growth at Dropbox, SurveyMonkey, Miro and several more. This article of hers covers NDR and retention curves.

Mixpanel is a product analytics tool. It's robust, comes with good UX, and is priced well. You can read more about their retention curves.
Churnkey is a retention automation platform. With Churnkey, you'll keep more customers with personalized cancel flows, recover more failed payments, and you'll expand customer-driven product development. You can start a free trial or get yourself a demo.
Lastly, you can read more about the state of retention in Churnkey's 2024 Benchmark reports.


Why is the User Retention Curve important for SaaS founders?
The user retention curve is crucial for SaaS founders for several reasons:
- Acquisition Efficiency: High retention rates mean users stay longer. That means more opportunities for word of mouth and viral loops.
- Monetization: Retained users generate more revenue over time.
- Sustainable Growth: High churn can undermine growth efforts and lead to business failure. That's what happened with Quibi.
- Product Improvement: Analyzing retention curves helps identify which features or aspects of the product need improvement.
- Investment Attraction: Investors often look at retention metrics as a key indicator of a company's health and potential for long-term success.
Retention curves help you build a more resilient and scalable business.
Thanks for reading!


