Churn Rate vs Retention Rate: Two Sides of The Same Coin?
Like the two-faced Greek God, Janus, retention rate and churn rate are intertwined.

Churn Rate vs Retention Rate
Churn Rate refers to the percentage of users or subscribers who stop using a product or service within a given time frame. Whereas Retention Rate measures the percentage of users or subscribers who continue to use a product or service over a specific period.
Visualize All Your Churn Metrics in 1-Click for Free
Get a free, visual analysis of your churn metrics and understand how your retention compares to other companies.
- Gross and new churn rates by date.
- Involuntary and voluntary churn rates.
- Revenue vs logo churn.
- Retention cohort analysis.
- New vs. old churn.
- Churn cake charts.
Visualize All Your Churn Metrics in 1-Click for Free
Get a free, visual analysis of your churn metrics and understand how your retention compares to other companies.
- Gross and new churn rates by date.
- Involuntary and voluntary churn rates.
- Revenue vs logo churn.
- Churn cohort analysis.
- New vs. old churn.
- Churn Cake charts
Relationship Between Churn vs Retention Rate
Churn is inversely related to retention rate. The higher the churn, the worse the retention. That's why Retention Rate = 100% - Churn Rate
It reminds me of Janus, the two-faced Greek god.

To calculate retention rate from churn rate, you simply need to subtract it from 100%. Say your churn rate is 30%, then your retention rate is 70% for the period.
Retention Rate Formula
To calculate your retention rate, divide the total number of renewing customers (initial customers minus any new customers acquired during the period) by the total number of customers at the start of the period.
Customer Retention Rate = (Total Customers at the End of Period - New Customers Acquired During Period) / Total Customers at Start of Period*100
Use our free retention rate calculator to quickly understand how your metrics impact revenue growth—no guesswork involved.
Churn Rate Formula
To calculate your revenue churn rate, divide your total revenue churned in a period by the total revenue from the beginning of your specified period
Want a faster way? Use our free churn rate calculator
How Churn Rate And Retention Rate Impact Business Performance
Retention drives long-term business growth, and Churnkey makes it easy. By automating retention strategies like customer reactivation flows, cancel flows, and failed payment recovery, our clients save 20-40% revenue that they would have otherwise lost to churn.
Churn rate and retention rate significantly impact business performance in various ways:
- Churn Rate Impact:
- Revenue Retention: High churn rates can lead to lower revenue retention. For instance, companies like Wix and Intuit, targeting smaller businesses, often experience less than 100% net revenue retention.
- Market Turnover: In markets with high turnover, like those targeting college students, high churn rates are expected. However, you can counter this by continually acquiring new users. At Thumbtack, 30% of small home professional businesses may go out of business annually and are replaced by new customers. [I remember reading this stat in a course by Dan Hockenmaier]
- Company Stage: The impact of churn rate varies with the company's stage. Early-stage companies may have higher churn rates, which can improve over time as they develop new monetization strategies and better understand their customer base.
- Retention Rate Impact:
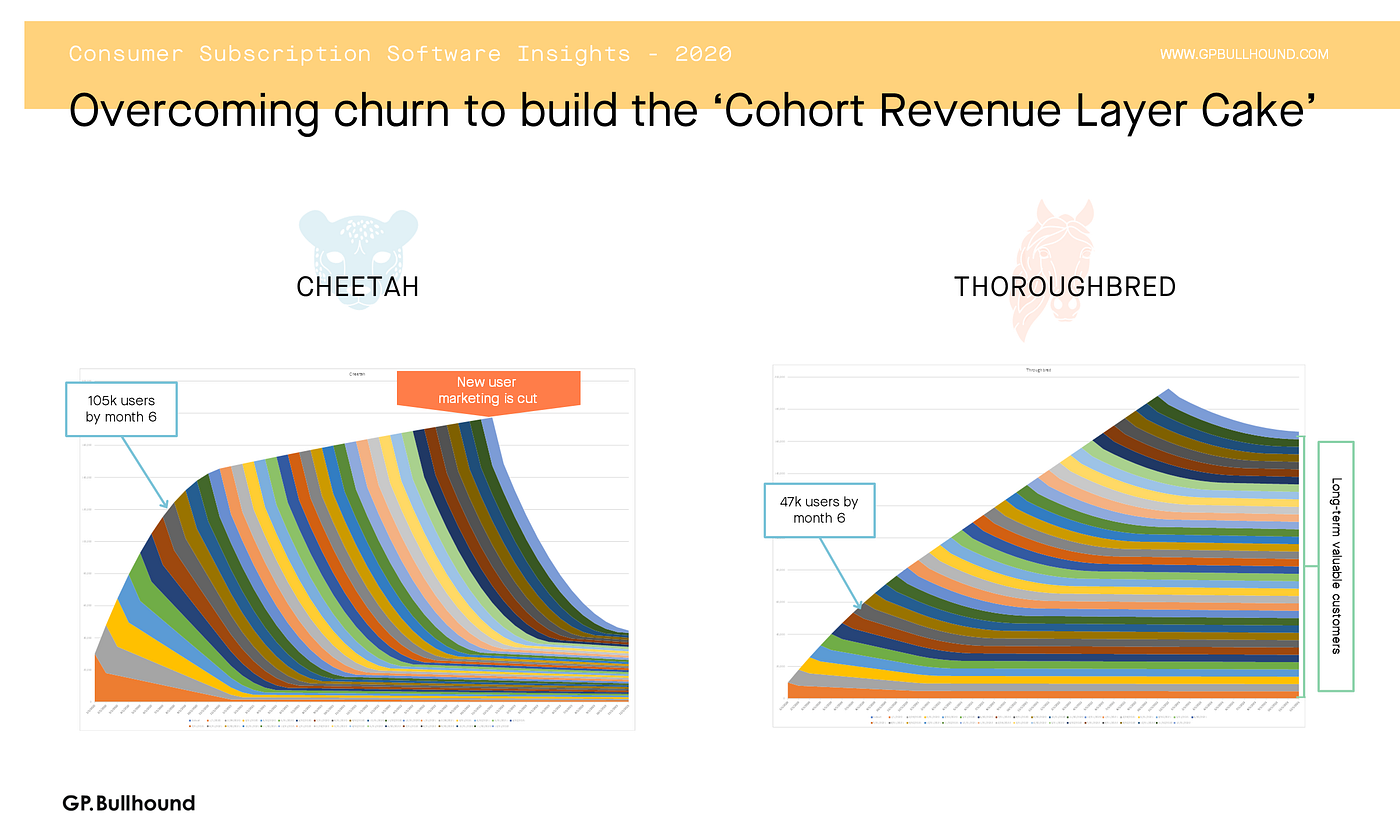
- Long-term Business Growth: Retention multiplies the impact of your actions. Consumer businesses boost retention by stacking mature subscriber groups and create a stable revenue base. They call it the "layer cake" effect.
- User Motivation: For example, Duolingo increased its current user retention rate (CURR) by 21% by focusing on product features that tapped into users' motivation, leading to a 4.5x increase in daily active users (DAUs).
- Feature Performance: Buggy or outdated features can lower retention, while useful and well-integrated features can improve it.
Metrics to Measure To Improve Churn Rate and Retention Rate
For tracking and improving retention, focusing on specific metrics can help you understand how well you're maintaining customer engagement and loyalty. Here are some key metrics:
- Customer Retention Rate: The percentage of customers who remain with your service over a given time period.
- Repeat Purchase Rate: This metric measures the percentage of customers who make more than one purchase over a specific time frame.
- Monthly Recurring Revenue (MRR) Retention Rate: Measures the percentage of recurring revenue retained from existing customers each month.
- Average Revenue Per User (ARPU): Increasing ARPU can indicate successful upselling or cross-selling to existing customers, contributing to retention.
- Customer Lifetime Value (CLV): A high CLV suggests good retention practices, as it suggests that customers continue to find value in your product over time.
- Customer Lifetime Value (CLV) to Customer Acquisition Cost (CAC) Ratio: A declining ratio may indicate increasing churn or decreasing customer value.
- Customer Acquisition Cost (CAC): The total cost of acquiring a new customer. Keeping track of CAC helps ensure you're not spending more to acquire a customer than they're worth in their lifetime.
- Engagement Rate: High engagement rates are typically correlated with higher retention.
- Active Users: Tracks the number of unique users who engage with your product within a day, week, or month
- Product Usage Frequency: High frequency indicates good retention, as users find value in returning to your product regularly.
- Customer Health Score: A composite metric that combines various indicators (e.g., product usage, satisfaction scores, support ticket frequency) to predict the likelihood of a customer remaining engaged and retained.
- Customer Satisfaction (CSAT): Low scores may signal unhappy customers who are more likely to churn.
- Net Promoter Score (NPS): NPS can indicate retention potential by identifying champions.
- Customer Churn Rate: The percentage of customers who cancel or do not renew their subscription within a specific time period.
- Revenue Churn Rate: Measures the percentage of revenue lost due to churned customers over a specific period.
- Gross Churn Rate: The total revenue lost from churned customers without accounting for new sales or expansions during the period.
- Net Churn Rate: Takes into account not only the revenue lost to churn but also the revenue gained from existing customers through upsells or cross-sells during the same period.
- Voluntary vs. Involuntary Churn Rate: Differentiating between customers who choose to leave (voluntary churn) versus those who are lost due to payment failures or other administrative issues (involuntary churn) can help in tailoring strategies to address each type. Churnkey's Precision Retries automatically recover failed payments through smart scheduling and multiple retries, drastically improving revenue retention without user intervention.
- Hard vs Soft Declines: You'd want to know whether you should focus on reducing hard declines or soft declines. Soft declines are temporary issues but hard declines are permanent ones.
- Churn by Cohort: Analyzing churn rate by specific customer cohorts (e.g., by acquisition channel, customer segment, or product tier) can reveal patterns and insights into which groups are more likely to churn and why.
- Time to Churn: Measures the average time it takes for a new customer to churn. This metric can help identify the critical period to engage customers and prevent churn.
- Upgrade/Downgrade Rate: For services with multiple tiers, tracking how many users upgrade to a higher tier versus downgrade to a lower one can provide insights into satisfaction and perceived value.
By tracking these metrics, you can gain a deeper understanding of churn dynamics, identify at-risk customer segments, and implement targeted retention strategies to reduce churn and improve overall customer loyalty.
What Is A Good Retention Rate?
A "good" retention rate can vary significantly across industries, products, and business models, making it challenging to define a one-size-fits-all benchmark. However, it's good to compare.
SaaS and Subscription-Based Businesses
- B2B SaaS: Above 90% annual retention rate is GOOD, and over 95% is GREAT.
- B2C SaaS: Good annual retention rate might range from 70% to 90%. B2C SaaS have higher competition and lower switching costs.
E-commerce and Retail
Retention rates vary widely, but a rate of 30% to 40% is considered strong.
Mobile Apps and Games
- Mobile Apps: A day-1 retention rate above 40% is excellent, but retaining 10% to 20% of users after 30 days is considered good.
- Mobile Games: Day-1 retention above 40% is great. However, genres and monetization strategies can significantly impact what rates are achievable.
Read more in our retention report:


What Is A Good Churn Rate?
Lenny's newsletter makes a good point that if you lose 8% of your users each month, that is effectively losing 2/3rds of your users each year.
Here are some alternative benchmarks to what we shared earlier:
- For B2C SaaS: Between 3% and 5% monthly churn is GOOD, and less than 2% is GREAT.
- For B2B SMB + Mid-Market: Between 2.5% and 5% is GOOD, and less than 1.5% is GREAT.
- For B2B Enterprise: Between 1% and 2% is GOOD, and less than 0.5% is GREAT.

Read more: Good churn benchmarks
Thanks for reading!